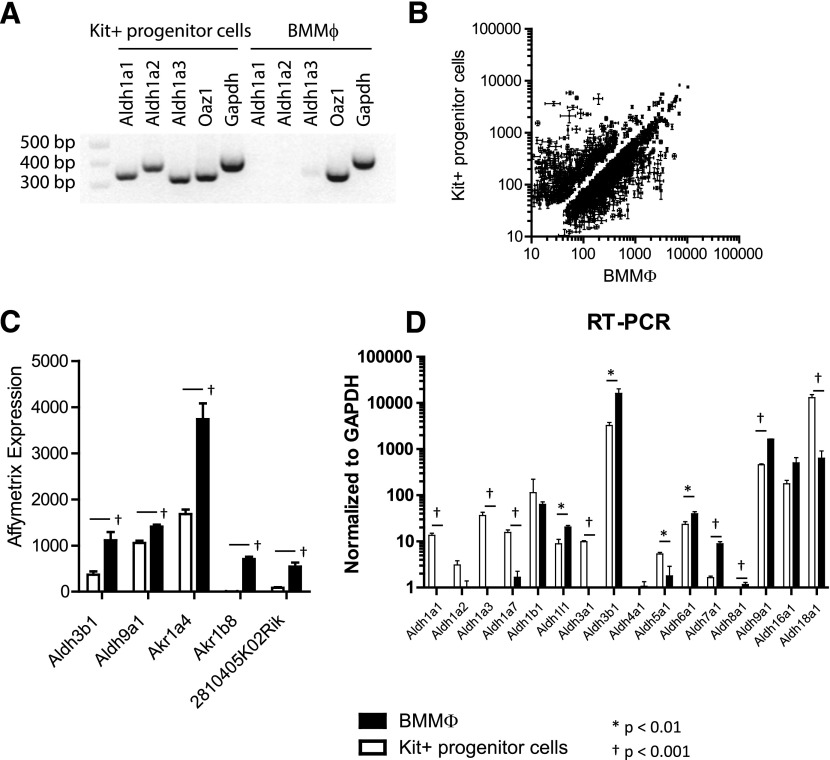
Figure 3. Differentially expressed enzyme transcripts in Kit+ progenitors and BMMφ.
(A) Semiquantitative RT-PCR analysis of Aldh1a1, Aldh1a2, and Aldh1a3 and 2 control transcripts, ornithine decarboxylase antizyme 1 (Oaz1) and Gapdh, in Kit+ progenitor cells and BMMφ. (B) Affymetrix expression array of Kit+ progenitor cells vs. BMMφ. (C) Affymetrix expression results for 5 transcripts with differential expression between Kit+ progenitor cells and BMMφ. Data normalized to chip mean of 1500. (D) Quantitative RT-PCR analysis of Aldh genes in Kit+ progenitor cells vs. BMMφ. In all studies, error bars represent sd of triplicate experiments.

