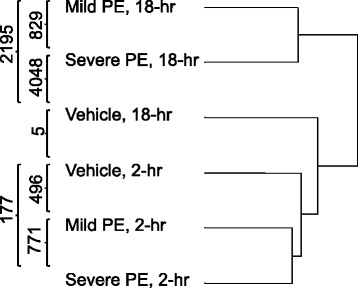
Fig. 1.

Hierarchical clustering of six treatment groups and results of pair-wise t-tests. Expression data from the six treatment groups were first compared by 2-way ANOVA using PE time as factor-1 and microsphere dose as factor-2. Relationships among the six treatments were determined using GeneSifters hierarchical clustering function applied to the 8075 Affymetrix probesets that passed the 2-way ANOVA. The separation of the six treatment groups on the dendrogram is based on relative Euclidean distance. Numerical data superimposed on the dendrogram are the results of pair-wise t-tests between the treatment groups
