Fig. 3.

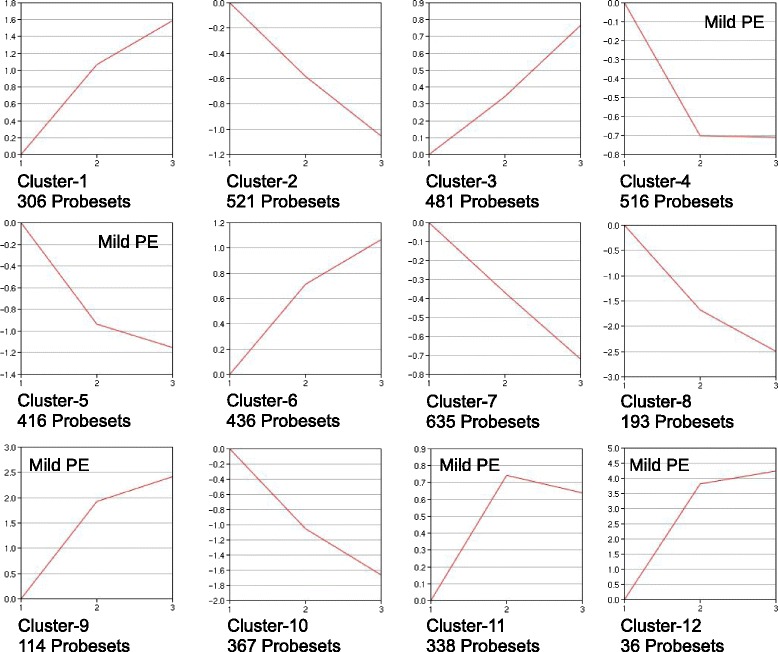
Clustering of 18-h treatment groups. Expression data from the three 18-h treatment groups (Vehicle, Mild PE, Severe PE; x-axis labels 1, 2, 3, respectively) were clustered as for Fig. 2

Clustering of 18-h treatment groups. Expression data from the three 18-h treatment groups (Vehicle, Mild PE, Severe PE; x-axis labels 1, 2, 3, respectively) were clustered as for Fig. 2