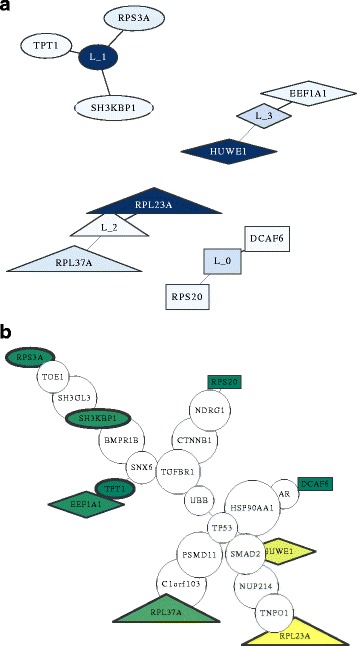
Fig. 3.

Visualization of one model. A sample model for TCGA-LAML gene expression data (a) individual classifiers and their selected features; higher confidence of a node is shown by a darker color, (b) selected genes plotted over the PPI network; green and yellow show low and high confidence respectively, and the thickness of the border of the node shows the respective confidence of the individual classifier to which it belongs
