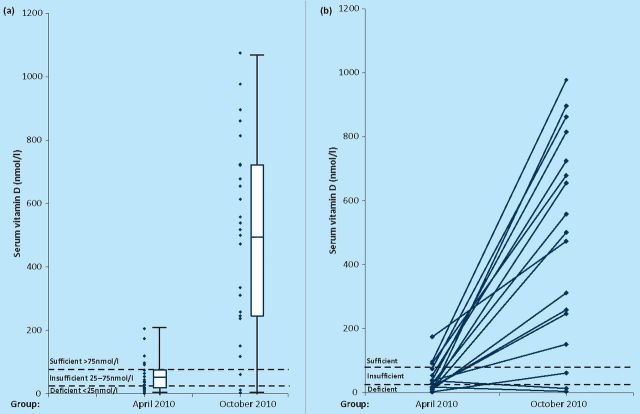
Fig 1.
(a) Combined scatter and box-and-whisker plot showing serum 25-hydroxyvitamin D levels (nmol/l) at the end of winter (April 2010) and end of summer (October 2010). The box indicates the mean +/− 1 standard deviation, and the whiskers the range. The dashed lines indicate the accepted levels for deficiency, insufficiency and sufficiency (<25 nmol/l, 25–75 nmol/l and >75 nmol/l respectively), p=1.35×10∘−8 for a difference between the two groups. (b) Graph showing the change in serum 25-hydroxyvitamin D levels (nmol/l) between the end of winter (April 2010) and end of summer (October 2010) between paired samples (ie the same subjects, rather than matched pairs, therefore not all subjects shown).

