Fig. 3.

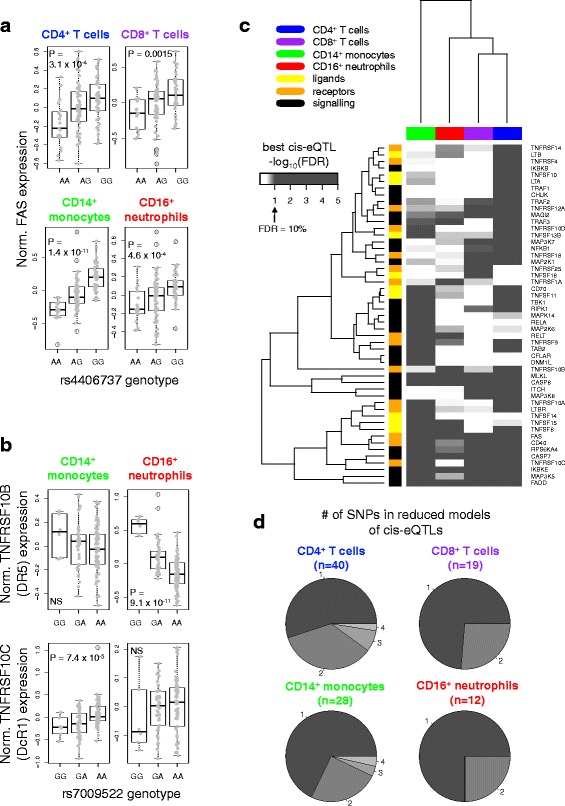
TNFSF-related genes are under extensive genetic regulation. a Normalised FAS expression in each cell subset is plotted against rs4406737 genotype. Association p values are indicated for eQTLs with FDR < 0.1. b Normalised TNFRSF10B and TNFRSF10C expression in monocytes and neutrophils is plotted against rs7009522 genotype. NS not significant. c TNFSF-related genes with a significant cis-eQTL (FDR < 0.1) in any cell type were extracted. For each gene, the SNP most significantly associated with expression in each cell type was extracted (best cis-eQTL) and the FDR corresponding to its p value in that dataset calculated. The plot depicts hierarchical clustering of the negative logarithm of these FDRs. Colours are as in Fig. 2. d The number of SNPs in cis-eQTL models after variable selection. Numbers around the periphery and grey shades indicate the number of eQTL SNPs remaining as predictors in the model for each gene. “n” indicates the number of genes with cis-eQTLs represented by each pie chart
