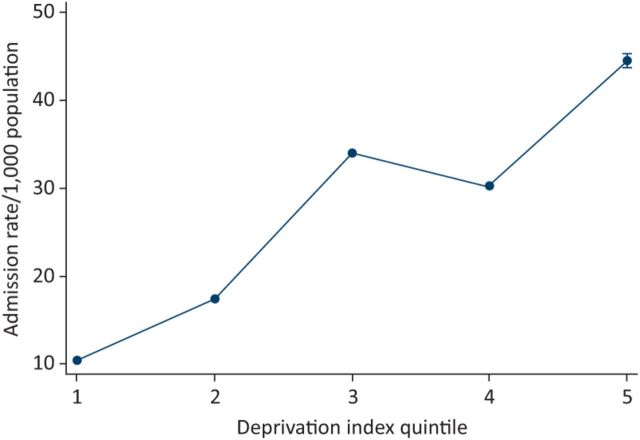
Fig 2.
Relationship between deprivation score and the admission incidence (rate/1,000 population) for ACSC. The predicted probabilities were derived from the multivariable truncated Poisson model using Stata's margins command; the effect with confidence interval is plotted based on the latter prediction. ACSC = ambulatory care sensitive conditions.

