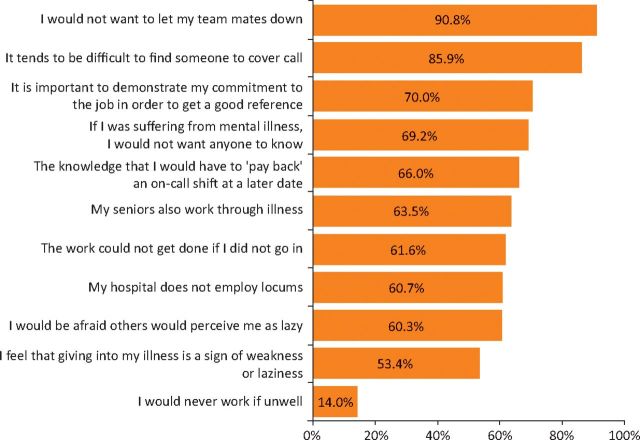
Fig 1.
Working through illness. Respondents rated how likely (definitely/probably/neutral/probably not/definitely not) 11 factors were to influence them to work through illness. This graph displays combined percentages for those who rated the factor as definitely or probably being likely to influence them.

