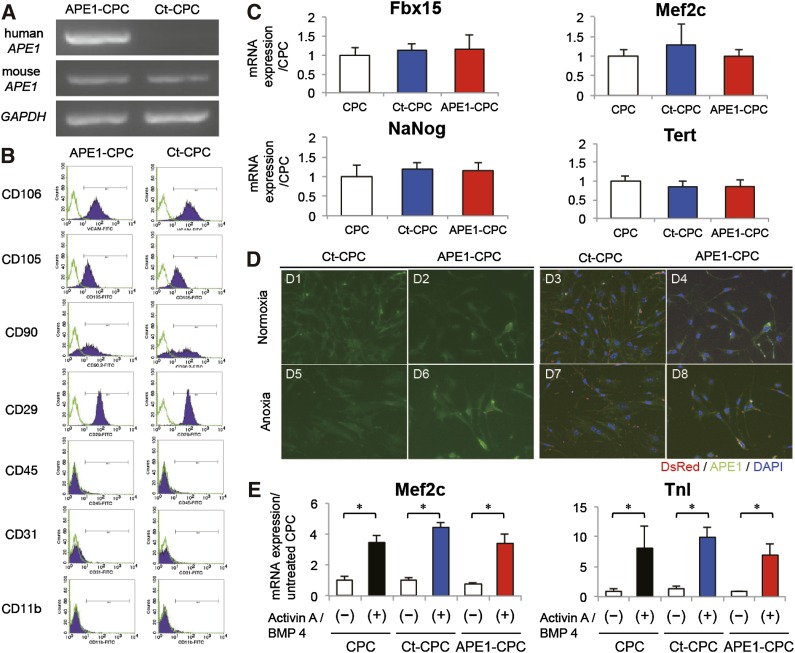
Figure 1.
Characteristics of APE1-overexpressing CPCs. (A): Exogenous human APE1 levels as determined by RT-PCR; expression was detected in APE1-CPCs but not control-CPCs. There was no difference in the expression level of endogenous mouse-APE1 between the two cell lines. (B): Analysis of cell surface marker expression in control-CPCs and APE1-CPCs (n = 3, respectively). Both cells were positive for vascular cell adhesion molecule, CD106, CD 29, CD105, and CD90 and negative for CD31, CD45, and CD11b. (C): Quantitative RT-PCR analysis showed the mRNA expression of transcriptional genes. There was no difference in the expression level of mouse Nanog (n = 10); F-box-containing protein 15 (Fbx15: n = 6), myocyte enhancer factor 2c (Mef2c; n = 6), and telomerase reverse transcriptase (Tert; n = 6) between the three cell lines. (D): Intracellular localization of APE1-protein in normoxic and anoxic conditions (n = 3, respectively). Left: green, APE1; right: merged image of APE1 (green), DsRed (red), and cell nuclei (blue). Magnification ×40. (E): Quantitative RT-PCR analysis showed the ratio of mRNA expression of cardiogenesis genes (Mef2c, troponin-I) compared with untreated CPCs in the three cell lines (n = 4, respectively). ∗, p < .05. Abbreviations: APE1, apurinic/apyrimidinic endonuclease/redox factor 1; BMP, bone morphogenetic protein; CD, cluster of differentiation; CPC, cardiac progenitor cell; Ct, control; DAPI, 4′,6-diamidino-2-phenylindole; GAPDH, glyceraldehyde-3-phosphate dehydrogenase; RT-PCR, reverse transcription-polymerase chain reaction; TnI, troponin I.

