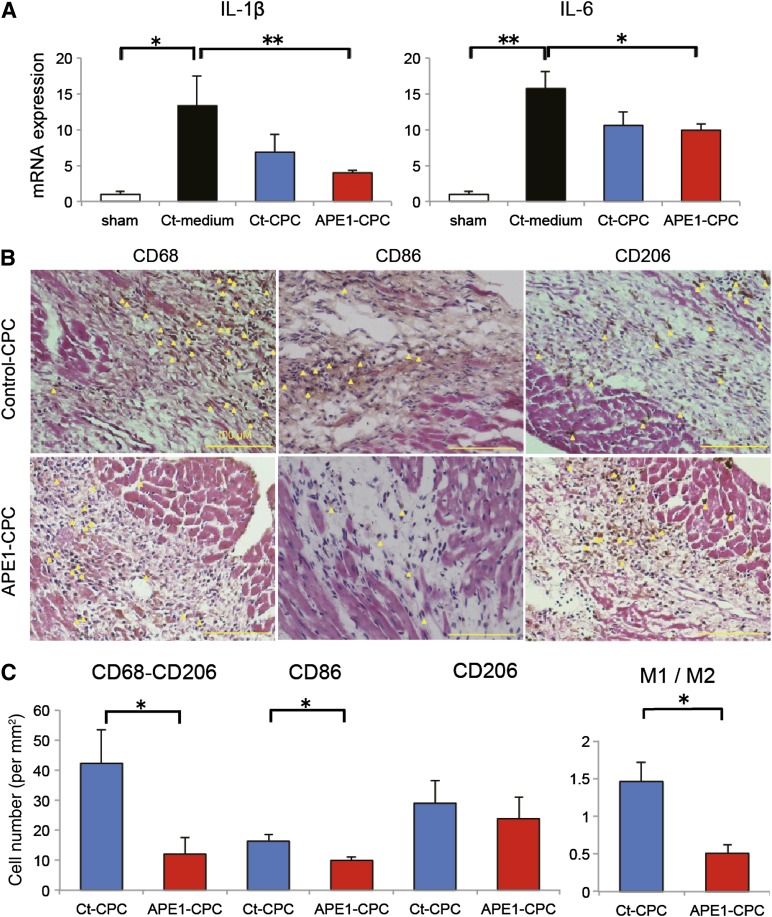
Figure 5.
Cardiac inflammation attenuated by transplantation of CPCs. (A): Quantitative RT-PCR analysis of mRNA expression in the heart tissue of proinflammatory cytokines IL-1β and IL-6 (n = 5 per group). (B): M1 and M2 macrophage activation in host ischemic heart 7 days post-MI. Representative cardiac tissue sections (hematoxylin and eosin staining) labeled with antibodies against CD68 (M1 and M2), CD86 (M1), and CD206 (M2) in the ischemic area. Yellow arrowheads indicate CD68-, CD86-, or CD206-positive macrophages (brown; 3,3-diaminobenzidine: DAB substrate). Scale bar, 100 μm. (C): Quantitative analysis of the number of M1 (CD68+CD206− and CD86+) and M2 (CD206+) macrophages in the ischemic area and M1/M2 ratio (n = 6 per group). ∗, p < .05, ∗∗, p < .01. Abbreviations: APE1, apurinic/apyrimidinic endonuclease/redox factor 1; CD, cluster of differentiation; CPC, cardiac progenitor cell; Ct, control; IL, interleukin; MI, myocardial infarction; RT-PCR, reverse transcription-polymerase chain reaction.

