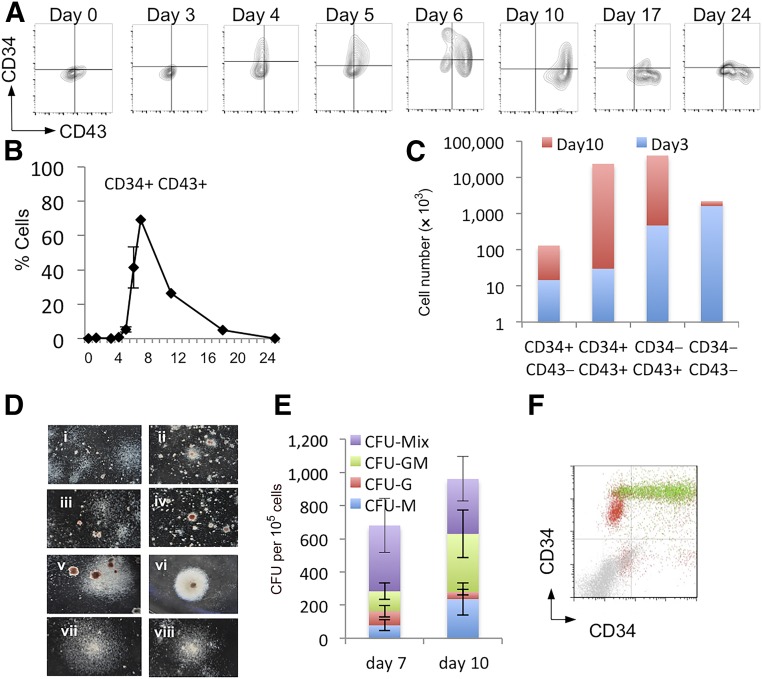
Figure 1.
Monitoring hematopoietic progenitor production throughout the differentiation protocol. Representative flow cytometry analysis of cells from days 0 to 24 of the differentiation protocol using antibodies against CD34 and CD43 (A) and the quantification of the percentage positive (B) was performed from at least three independent experiments. Absolute cell numbers of the differentiation represented in (A) are shown for days 3 and 10 (C). Representative colonies generated from day 7 (Di–Div) and day 10 (Dv–Dviii) cells are shown, CFU-C activity having been assessed by methylcellulose assays on days 7 and 10 (E). These data represent three independent experiments, and bars indicate the SEM. Flow cytometry analysis to assess the expression of Runx1C-GFP in the CD34/CD43 double-positive cell population; Runx1C-GFP+ cells are shown in green and Runx1C-GFP− cells in red (F). Original magnification ×60. Abbreviations: CFU, colony-forming unit; G, granulocyte; GFP, green fluorescent protein; GM, granulocyte macrophage; M, macrophage; Q, quartile.

