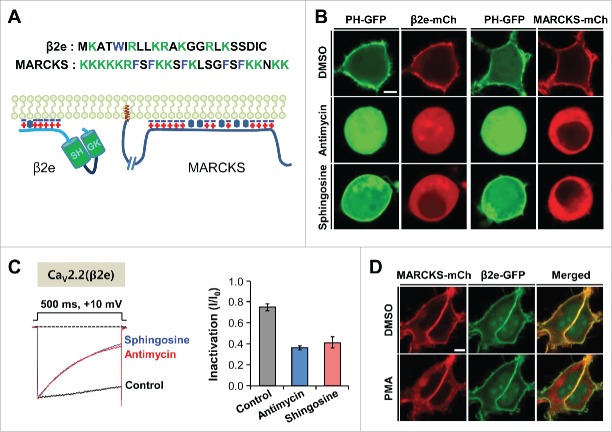
Figure 1.
Membrane tethering of β2e and MARCKS was antagonized by the reduction of negative charges in the inner leaflet of the plasma membrane. (A) Sequences of N-terminal region of β2e and effector domain of MARCKS (Top) and schematic representations of membrane-bound β2e and MARCKS (Bottom). Blue minus signs and red plus signs indicate acidic lipids and basic amino acid residues, respectively. Hydrophobic residues and myristoylation are represented by hexagons and brown colored signs (MARCKS), respectively. (B) Confocal images of cells expressing PH-PLCδ-GFP (PH-GFP) and β2e-mCh (mCherry) or PH-GFP and MARCKS-mCh in response to 200 nM antimycin/10 mM deoxyglucose or 75 µM sphingosine. The cells were pretreated with the drugs for 40 min. Bar, 5 μm. (C) Effect of antimycin and sphingosine on current inactivation of CaV2.2 channels. Currents were recorded during 500-ms test pulses to +10 mV. Dashed line indicates the zero current. For analysis, n = 5-6. (D) Confocal images of cells co-expressing MARCKS-mCh and β2e-GFP in response to 500 nM PMA for 2 min. Bar, 5 μm.

