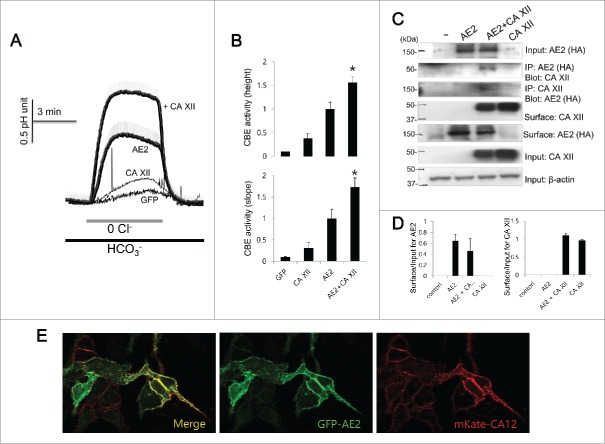
Figure 5.
CA XII activates AE2 and shows analogous cellular distribution (A and B) HeLa cells were transfected with AE2 only or AE2 + CA XII. CBE activity was assessed by the slope of pHi in the absence of Cl− at the beginning of time course (30 ∼45 sec) and height to reach the maximum pHi point from the minimum point. The bars show the mean ± SEM. (*P < 0.01). (C) The Co-IP and surface expression of CA XII with AE2. Anti-HA and anti-CA XII antibodies were used for the Co-IP. Input β-actin was used as a loading control. Co-IP of actin was used as a loading control. (D) Analysis of Co-IP and surface expression of CA XII. The bar graphs show the mean ± SEM. (E) Images of HeLa cells transfected with the indicated plasmids showing the localization of AE2 (GFP, green) and CA XII (mKate, red). The (-) represented cell lysates.

