
Figure 2.
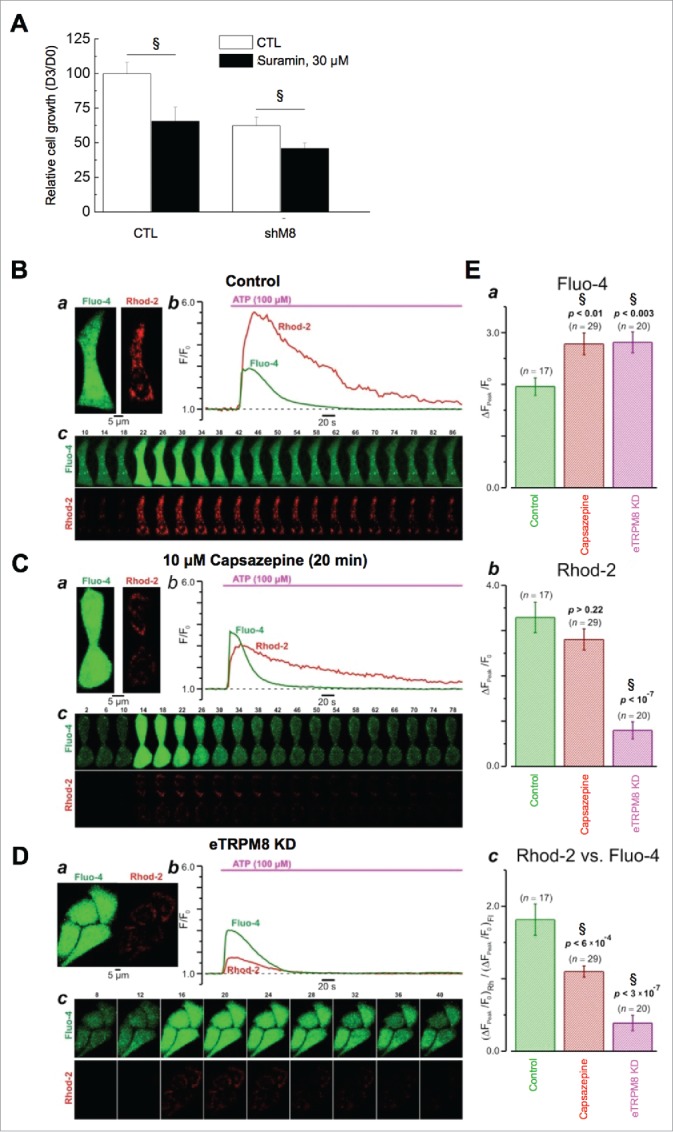
Interplay between eTRPM8 and the purinergic pathway controls the proliferation of keratinocytes at 37°C. (A). Bar diagram plot illustrates growth of HaCaT keratinocyte cell line during 3 d. Cells were incubated with or without 30 µM Suramin in order to inhibit purinergic receptors. Data are presented as fold increase of the cell number from day 0 and have been normalized by the control condition. n = 3. §: p < 0.05. (B). Effect of eTRPM8 inhibition on cytosolic (fluo-4) and mitochondrial (rhod-2) [Ca2+] transients induced by 100 μM ATP in HaCaT cells. The plots (b) show the time course of ATP-induced changes in the fluorescence intensity (F/F0) of fluo-4 and rhod-2 (as indicated) for the cell(s) in control (a, top) and following 20 min incubation with 10 µM capsazepine (C). The galleries (c) show confocal images of fluo-4 and rhod-2 fluorescence captured at times depicted above the images. (D). The same as B but obtained from eTRPM8 knockdown HaCaT cells. Note, that plots in (Cb, bottom) and in (Db) show mean traces for the 2 and 4 cells, respectively. E. The bar diagram plots compares the peak amplitudes of the ATP-induced responses (ΔF/F0) in cytosol (a), mitochondria (b) and the peak amplitudes of mitochondrial response normalized to that in cytosol (c). The number of responses analyzed (n) and p are indicated above the bars.