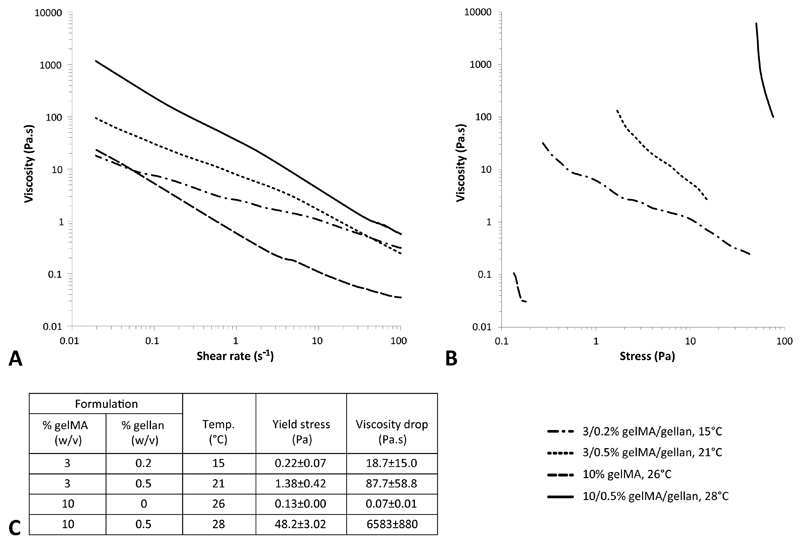
Fig. 4.
Rheological measurements to support filament printing observations. The viscosity decreased for increasing shear ratse for all formulations (A). Yield stress and corresponding viscosity drop differed between formulations (B, C). Measurements were performed at the optimal bioprinting temperatures or at 15°C when no filament could be printed (C). Please note the logarithmic axes and that the viscosity drop was measured over 1 decade of stress starting from the yield stress, except for 10% gelMA which reached a plateau before one decade difference.

