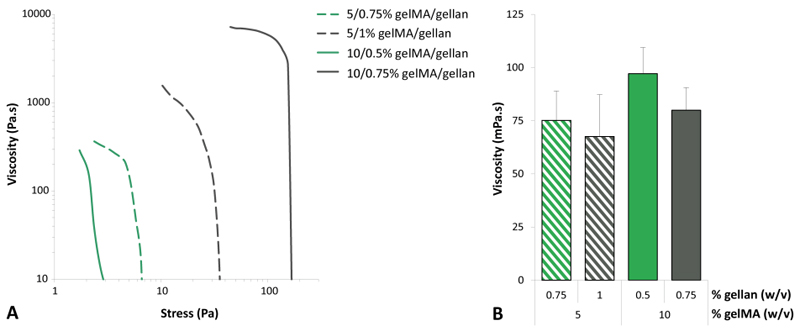
Fig. 5.
Quantitation of rheological parameters that determine the ability to mix in cells. In green the formulations inside the bioprinting window and in grey the corresponding formulations above the bioprinting window. Yield stress and initial viscosity were relatively high for the formulation in which no cells could be resuspended (grey lines in A) while the viscosity, in flow, was similar for all the formulations (B, shear rate = 300/s). All measurements were performed at 37°C. Please note the logarithmic scales in figure A.

