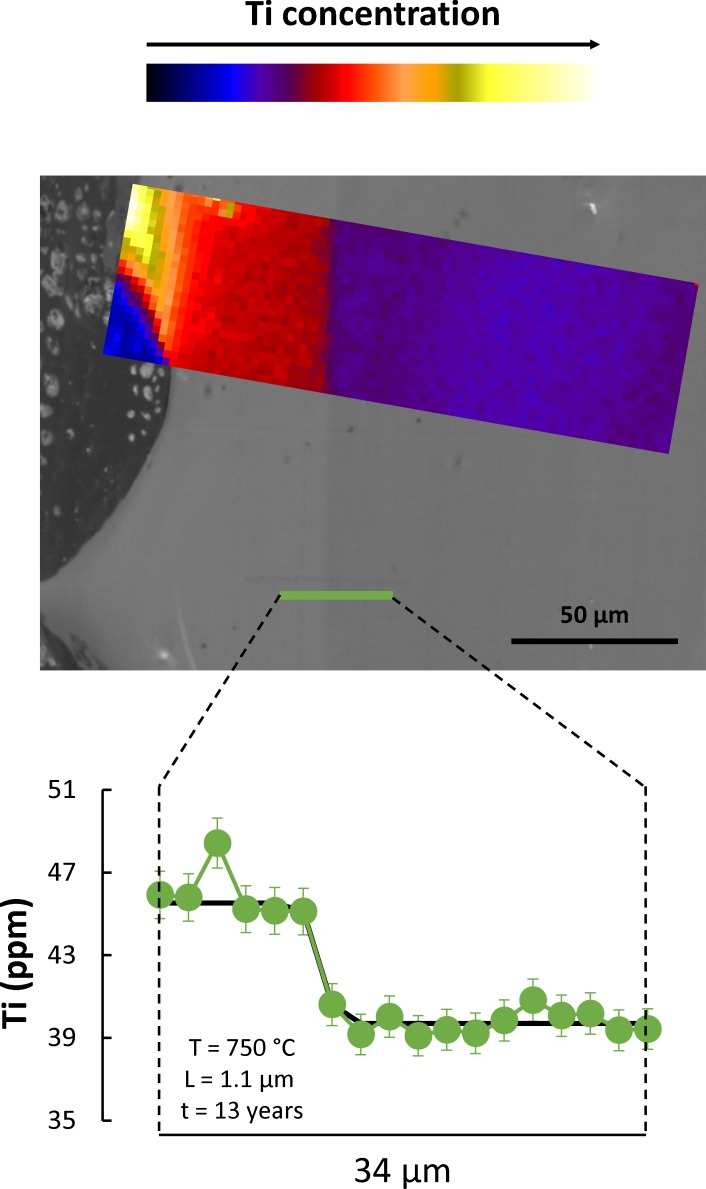
Fig 2. Correlation between CL intensity and Ti concentration in quartz.
Central grayscale image is a detailed cathodoluminescence (CL) image of the rim region of a quartz crystal (fall unit F8 of the Bishop Tuff, following nomenclature of [2]), including the boundary between the bright-CL rim and the duller-CL interior. Color inset is a Ti map obtained using the x-ray microprobe at insertion device beamline of GeoSoilEnviroCARS (Advanced Photon Source, Argonne National Laboratory); color scale corresponds to Ti concentration, as indicated on the top bar. The correlation between CL and Ti concentration is apparent, with largely homogeneous Ti concentrations in the rim and in the interior of the crystal, and a very sharp transition between the two. The bottom diagram shows a quantitative profile across the same boundary in a slightly different position, as indicated in the CL image. The transition between bright-CL, high-Ti rim and interior takes place within one step in the profile, which corresponds to 2 μm; this shows that the diffusional length scale of interest is on the order of 1 μm or less. We obtain a maximum growth time for this contact of 13 years (fitted complementary error function shown in black), which places an upper bound on the growth time for these rims.

