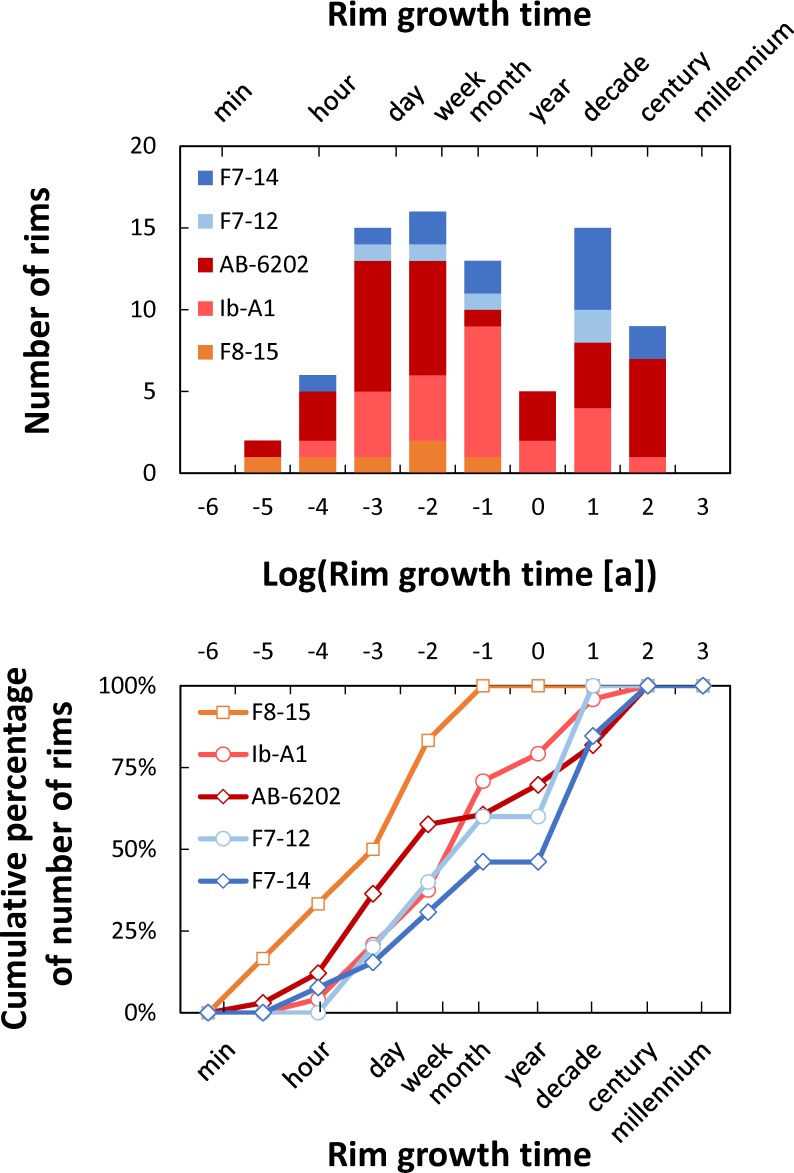
Fig 5. Timescales of rim crystallization for the Bishop Tuff, CA.
Top panel shows histogram of calculated times. Bottom panel shows cumulative distributions. Notice that bin sizes are on a logarithmic scale on both plots. Crystals from samples F8-15 (fall unit F8), Ib-A1 (flow unit Ig1Eb), and AB-6202 (flow unit Ig2NW) were imaged at 5 kV (red and orange colors), while those from F7-12 and F7-14 (both from fall unit F7) were imaged at 15 kV (blue colors); see text for details. Distribution has a mode at times of 10−2 years (~3 days), and more than 50% of the calculated times are less than 0.1 years (~1 month), particularly so for the crystals imaged at 5 kV.

