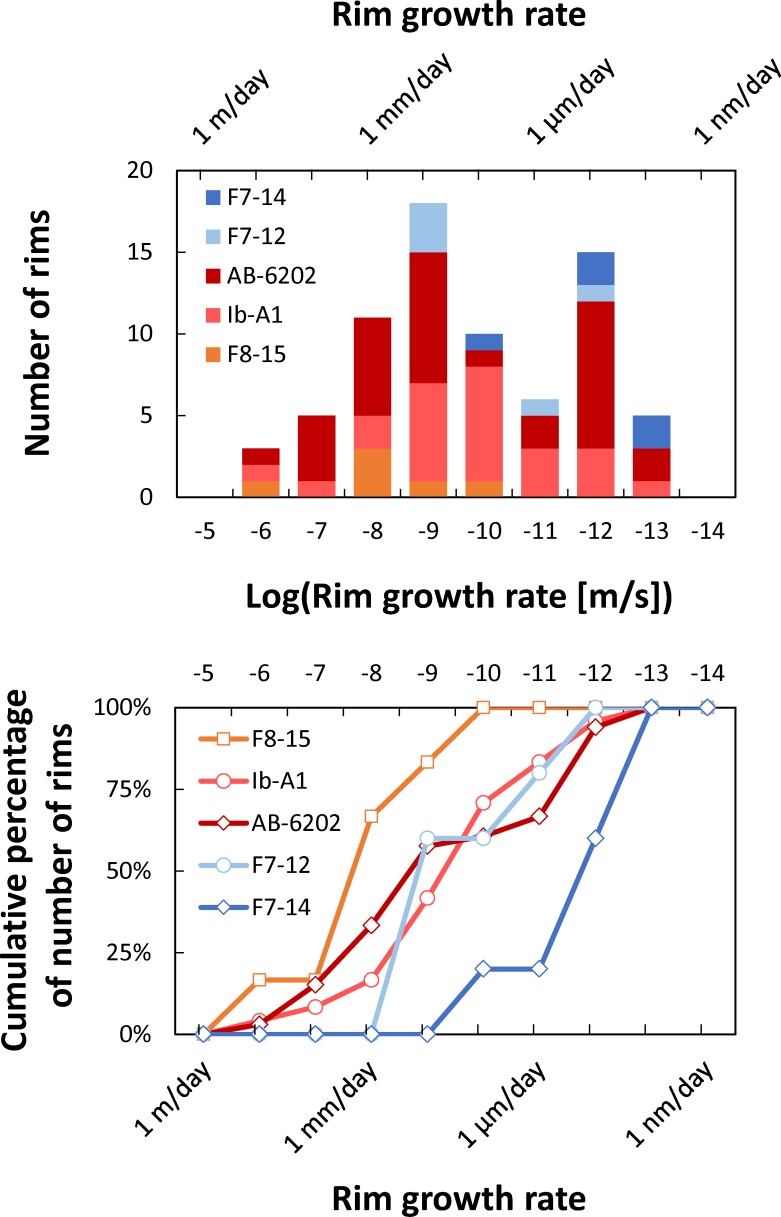
Fig 6. Crystal rim growth rates for the Bishop Tuff, CA.
Top panel shows histogram of calculated growth rates. Bottom panel shows cumulative distributions. Notice that bin sizes are on a logarithmic scale on both plots. Distribution has a mode at growth rates of 10−9 m/s (~90 μm/day), and more than 50% of the calculated growth rates are faster than 10−10 m/s (~9 μm/day).

