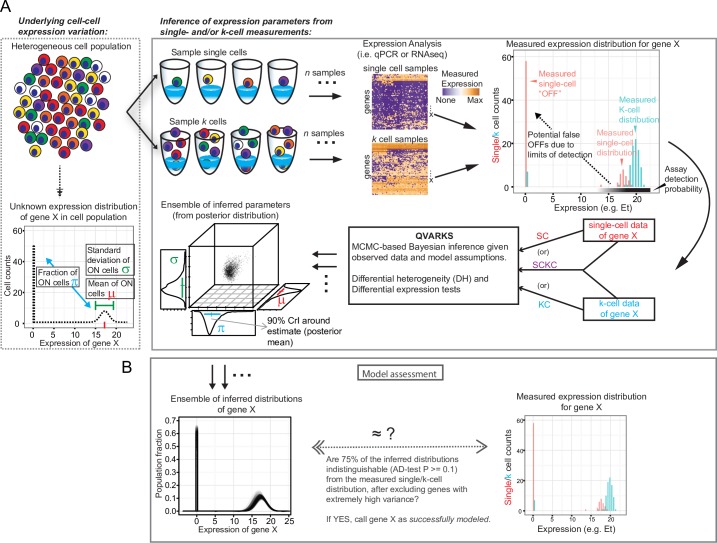
Fig 1. The QVARKS methodology and its three input data modes (SC, KC and SCKC methods).
(A) Schematic of our experimental and computational strategy (right box) for quantifying cell-to-cell variation in gene expression (left box) by integrating k- and/or single-cell expression profiles is shown (see text for additional details). Our approach can utilize single-cell data alone, or k-cell data alone, or both together as input to infer cellular heterogeneity parameters (CHPs). MCMC stands for Markov Chain Monte Carlo, and our gene expression data is measured in Et = 40-Ct units for qPCR (both in this figure and rest of the paper; please note that Et approximates log2(transcript counts) as explained in Methods). (B) Schematic of our AD-test based model assessment criteria (see text and Methods for details).

