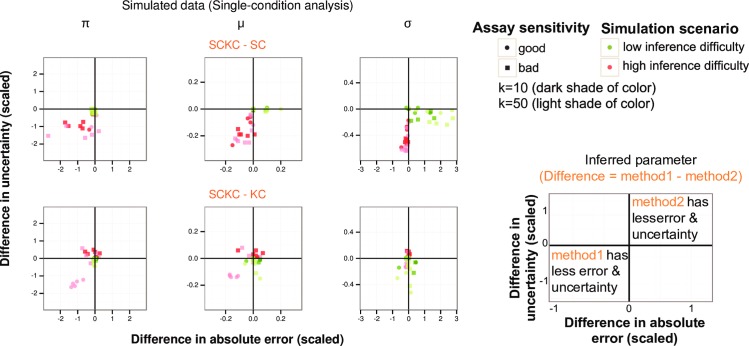
Fig 2. Comparison of SC, KC and SCKC methods using single-condition simulations.
Simulation results for single-condition parameter inferences, where each dot corresponds to an inferred parameter for a gene simulated under one condition according to the simulation scenario denoted by the legend. Diverse scenarios of varying levels of inference difficulty, measurement noise and assay sensitivity/detection (see Methods and S1 Fig) were used to generate simulated data. Parameter inferences (posterior mode and 90% CrI based on a grid-based posterior scan) were made for ten simulated datasets (sample size n = 1000) and the mean is shown here for each scenario and method. Each plot compares the performance of the two indicated methods as follows: The x-axis indicates the difference in the absolute error of the two methods’ estimates divided (scaled) by the true parameter value (if non-zero)—here absolute error is defined as the magnitude of the estimate minus the true parameter value; the y-axis is the difference in the CrI width of the two methods’ estimates divided (scaled) by the true parameter value (if non-zero). Alongside the legend is the guide to understand the simulation result plots indicating the quadrants where one method outperforms the other. See the legend for simulation result plots in conjunction with Methods and S2 Fig to obtain a complete description of the simulation scenario (including measurement noise setting) underlying each dot in the plots. Note that S2 Fig is an expanded version of the figure shown here containing additional results on KC vs. SC, as well as medium inference difficulty and medium assay sensitivity.

