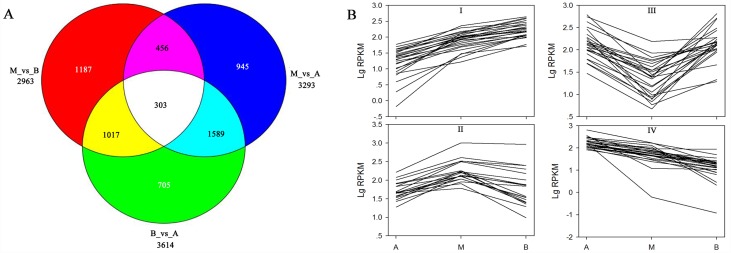
Fig 3. DEGs Venn diagram and expression profile.
(A) Venn diagram of DEGs. A, apical stem segment; M, middle stem segment; B, basal stem segment. (B) Four expression profiles of DEGs. I and IV indicate UniGenes which are up-regulated and down-regulated, respectively, and II and III indicate those with irregular expression. Twenty-five UniGenes were selected for the diagram for each expression profile.

