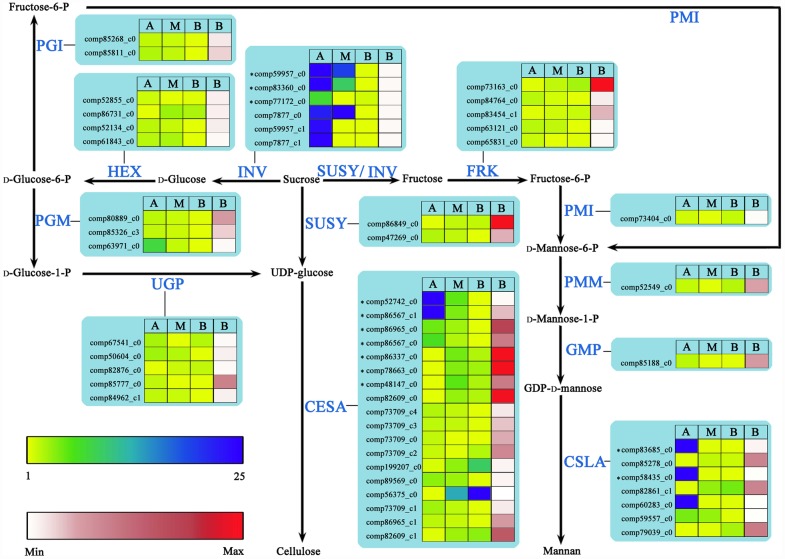
Fig 5. UniGenes involved in cellulose and mannan biosynthesis in wood-forming tissues of N. cadamba.
Sugar and polymer intermediates are shown in black, whereas the proteins (enzymes) involved in each step are shown in blue. Detailed protein names, annotation and RNA-Seq expression data are provided in S12 File. * indicates the DEGs. Yellow-blue scale and white-red scale indicate relative and absolute expression profiles, respectively. A, apical stem segment; M, middle stem segment; B, basal stem segment. Absolute expression level (RPKM) is only shown for basal stem segment. CESA, cellulose synthase; CSLA, cellulose synthase like A; FRK, fructokinase; GMP, GDP-D-mannose pyrophosphorylase; HEX, hexokinase; INV, invertase; PGI, phosphoglucose isomerase; PGM, phosphoglucomutase; PMI, phosphomannose isomerase; PMM, phosphomannomutase; SUSY, sucrose synthase; UGP, UDP-glucosepyrophosphorylase.

