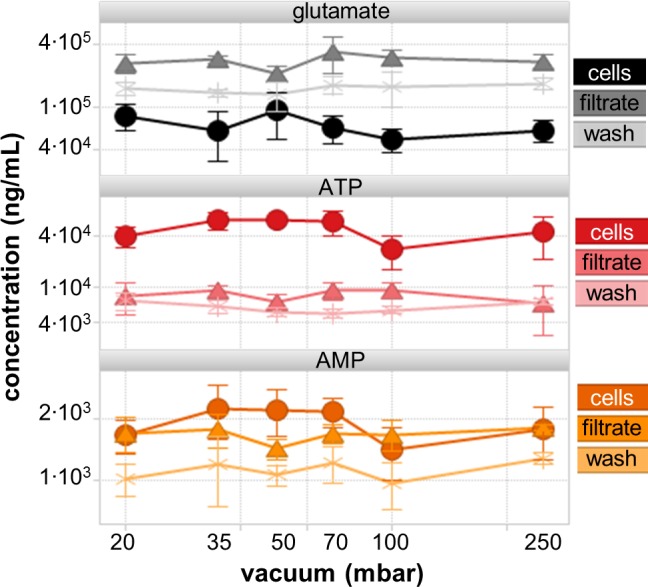
Fig 2. Impact of vacuum strength on glutamate, ATP and AMP levels in CHO cells, in filtrate or in washing solution was low (5 replicates, all scales are logarithmic).

All other quantified metabolites (GSH, NAD, ADP, G6P) exhibited similar curves and are not shown for the sake of clarity. The example metabolites were selected due to their biological interest, size difference, cell culture medium content (e.g. glutamate) or in literature described possible leakage [25]. Metabolite level changes compared to 35 mbar were not statistically significant (Student’s t-test, all p values above 0.05).
