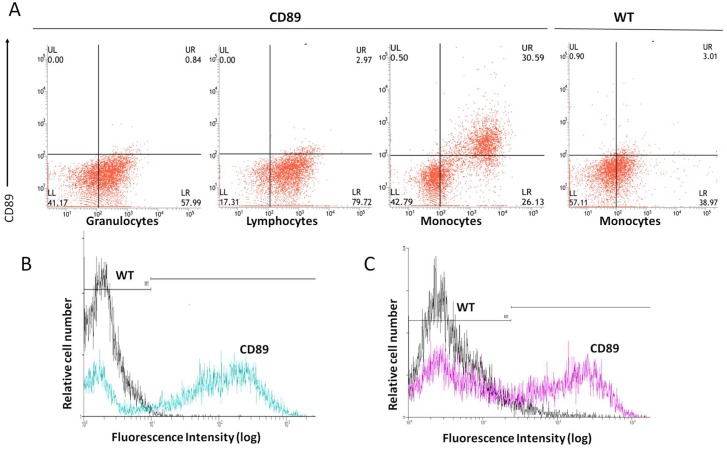
Fig 2. CD89 expression on the surface of monocytes/macrophages of CD89 transgenic mice.
(A) Flow cytometric analysis of CD89 surface expression on mouse blood cells. Cells of non-transgenic and transgenic mice were stained with anti-CD89-FITC. Cells were stained with Gr-1-PE, CD45/B220-PE or Ly6C-PE to identify granulocytes, lymphocytes and monocytes/macrophages, respectively. Experiments shown are representative of at least three independent experiments, yielding essentially identical results. (B, C) CD89 Expression of bone marrow monocytes (B) and peritoneal macrophages (C) in Tg mice and WT mice, detected by anti-CD89-FITC mAb.

