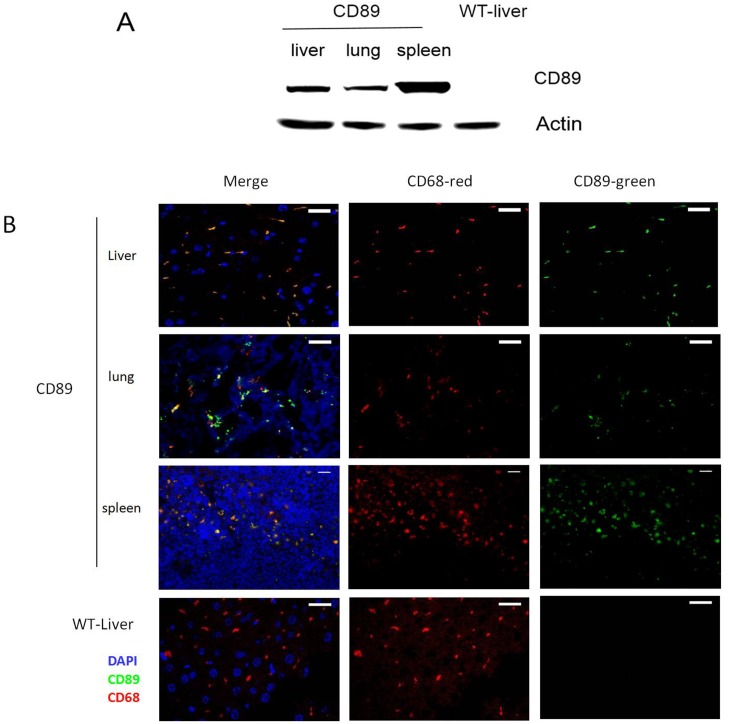
Fig 3. CD89 expression in the tissues of transgenic mice.
(A)Western blot analysis of CD89 transgenic mice: Protein levels of the CD89 were measured in lysates of livers, lungs and spleens from CD89 transgenic mice and littermate WT mice. (B) Double immunofluorescent staining for CD68 (red) and CD89 (green) in frozen sections of liver (Kupffer cells), lung (dust cells) and spleen macrophages from CD89 Tg mice versus liver from WT mice; Cell nuclei were stained with DAPI (blue). Bar:10μm.

