
Figure 2.
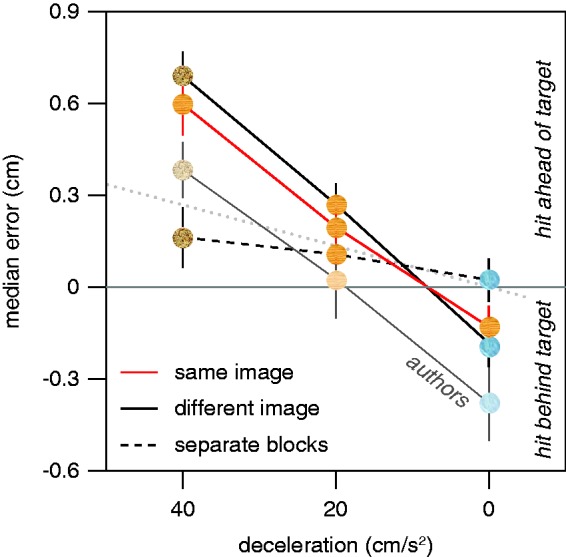
Median horizontal errors in Experiment 1. The three different amounts of deceleration (simulated friction) were interleaved at random with the target always moving across a wooden surface (same image), interleaved at random with the target moving across a surface of ice when the deceleration was 0 cm/s2, across a wooden surface when the deceleration was 20 cm/s2, and across a plane of sand when the deceleration was 40 cm/s2 (different image), or presented in separate blocks of trials for each deceleration with its associated image (separate blocks). The faint symbols represent additional results for six authors in the different image condition. The dotted line shows the errors that would arise from not considering the acceleration during the last 116 ms.