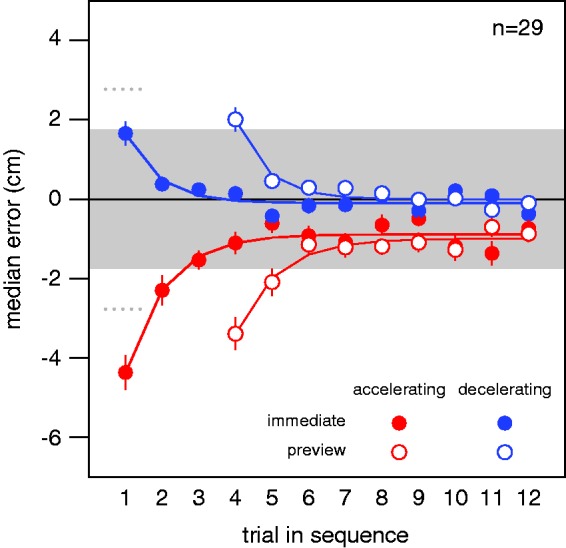
Figure 3.

Median horizontal errors in Experiment 2. Error as a function of the trial’s position within the sequence of 12 trials with the same condition and acceleration. Means and standard errors of the participants’ median horizontal errors. The grey area indicates the target’s maximal extent. The curves are fits of the simple learning model to the mean data. The dotted lines at Trial 1 show the errors one would expect if participants used the acceleration during the previous sequence to predict the target’s displacement during the last 169 ms.
