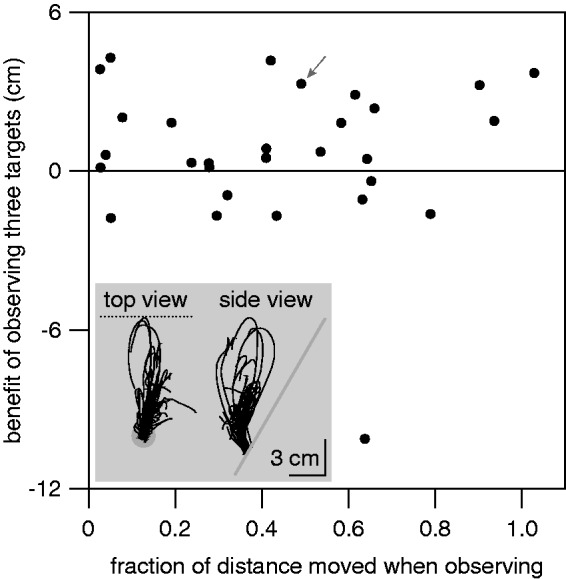
Figure 4.

Participants who moved more did not benefit more from the red targets. The inset shows a top and side view of all of one participant’s finger movements during the first 800 ms after red targets appeared. These traces are for the participant indicated by the arrow in the main panel. In the top view (movements parallel to the screen), the grey disk represents the starting point and the dotted line indicates the target’s path. In the side view, the grey line represents the screen surface.
