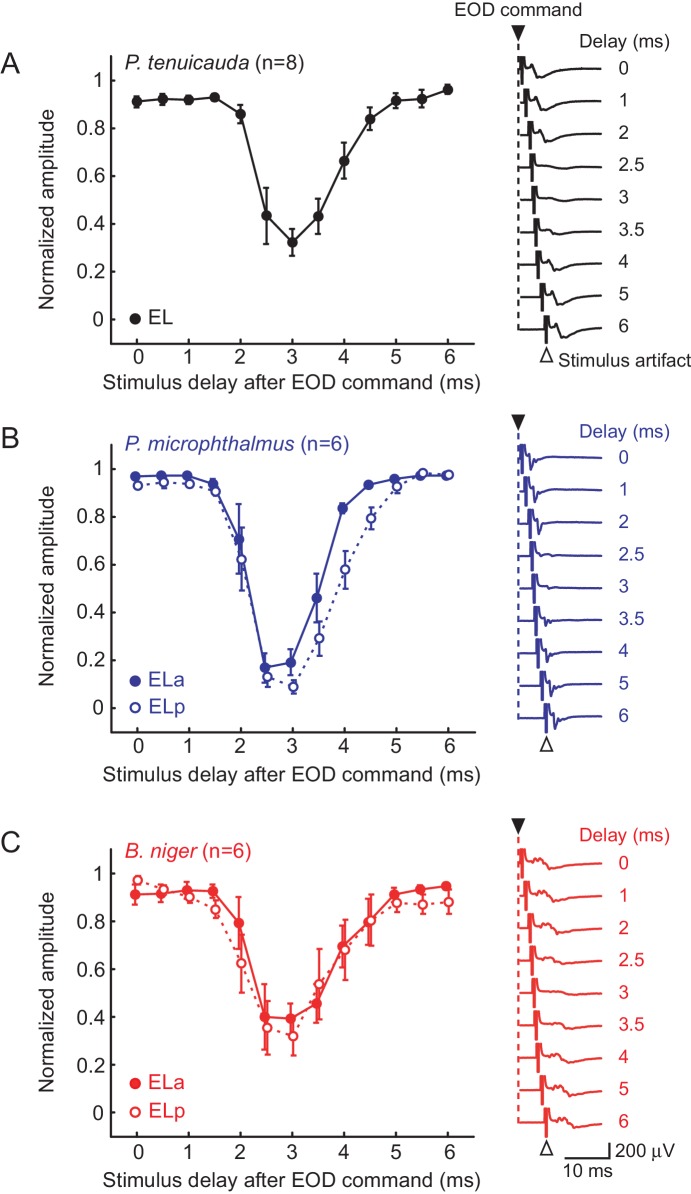
Figure 2. Evoked potentials in the midbrain are blocked by a corollary discharge of the EOD motor command.
Effect of stimulus delay with respect to the spinal EOD motor command on the amplitude of evoked potentials in P. tenuicauda (A), P. microphthalmus (B) and B. niger (C). Evoked potentials in P. tenuicauda were obtained throughout EL, in locations varying from more anterior to more posterior, as in (i) and (ii) in Figure 1A. In (B) and (C), full symbols represent data from the anterior division of the exterolateral nucleus (ELa) and open symbols represent data from the posterior division (ELp). We measured the peak-to-peak amplitude of the evoked potential at each latency and normalized them to the maximum value for each fish tested and at each nucleus. Traces on the right are representative mean evoked potentials (n = 10 traces) when the stimulus was delivered at delays of 0, 1, 2, 2.5, 3, 3.5, 4, 5, and 6 ms with respect to the EOD command. Each symbol in (A), (B), and (C) represent the mean normalized amplitude and the error bars represent the S.E.M.

