. 2016 Jul 20;5:e15550. doi: 10.7554/eLife.15550

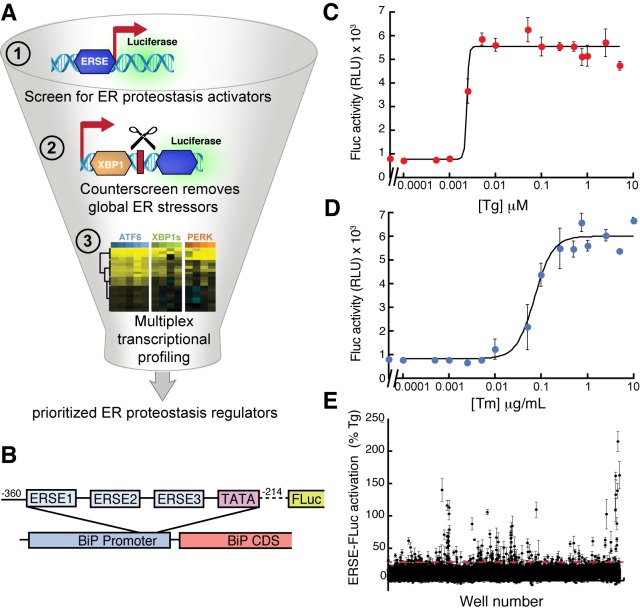
Figure 1. High-throughput screen to identify small molecule ER proteostasis regulators.

(A) Illustration showing the three-tiered screening strategy implemented to identify small molecules that preferentially activate the ATF6 transcriptional program. (B) Schematic of the ERSE-firefly luciferase (FLuc) reporter used in our HTS approach. (C) Activation of FLuc luminescence in HEK293T-Rex cells stably expressing ERSE-FLuc treated with the indicated concentrations of thapsigargin (Tg) for 18 hr. Error bars represent standard deviation for n = 3 replicates. (D) Activation of FLuc luminescence in HEK293T-Rex cells stably expressing ERSE-FLuc treated with the indicated concentrations of tunicamycin (Tm) for 18 hr. Error bars represent standard deviation for n = 3 replicates. (E) Plot showing ERSE-FLuc activation in HEK293T-Rex cells stably expressing ERSE-FLuc treated with the 13,748 small molecule ER proteostasis activators identified in the primary screen (6.8 µM; 18 hr). Luminescence is shown as % signal relative to Tg treatment (500 nM; 18 hr). Error bars show standard deviation for n = 3 replicates. The dashed red line shows 25.1% Tg activity.

DOI: http://dx.doi.org/10.7554/eLife.15550.003

Figure 1.

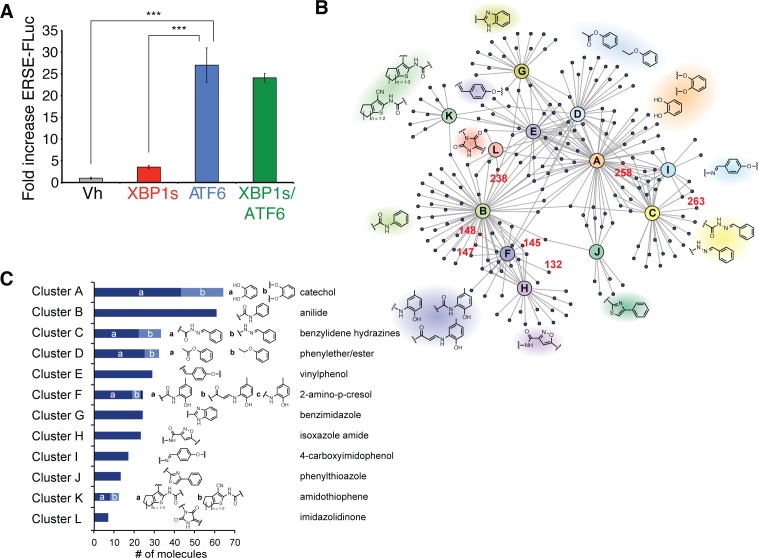
Figure 1—figure supplement 1. Selectivity of the ERSE-FLuc reporter for the ATF6 UPR arm and highly represented chemical substructures in the top 281 ER proteostasis regulators.

Figure 1—figure supplement 1.

(A) Activation of ERSE-FLuc in HEK293DAX cells stably expressing trimethoprim (TMP)-regulated DHFR-ATF6 and doxycycline (dox) inducible XBP1s. Dox (1 µM; 12 h) was added to selectively activate XBP1s (red) and TMP (10 µM; 12 h) was added to activate DHFR-ATF6 (blue), or both were added to activate both XBP1s and ATF6 (green). Error bars show standard error for n = 3. ***p<0.001. (B) Network plot depicting the 12 overrepresented structural moieties (A-K) identified by performing a hierarchical maximum common substructure search of the top 281 small molecule ER proteostasis regulators. The 8 prioritized small molecule ER proteostasis regulators are shown in red. (C) Bar graph showing the prevalence of the 12 most represented chemical moieties identified in the top 281 ER proteostasis regulators. JKlustor was used for clustering and diversity analysis of these molecules, JChem 6.2.2, 2014, ChemAxon (http://www.chemaxon.com). A hierarchical maximum common substructure search of the top 281 small molecule ER proteostasis regulators was carried out using LibraryMCS within JKlustor. A substructure search of the 12 most represented moieties (including derivatives indicated by small letters “a” and “b” was then carried out in the 281 compound set to account for the presence of multiple moieties within the same compound. See the network plot in B for visualization of compounds containing multiple highly represented moieties.