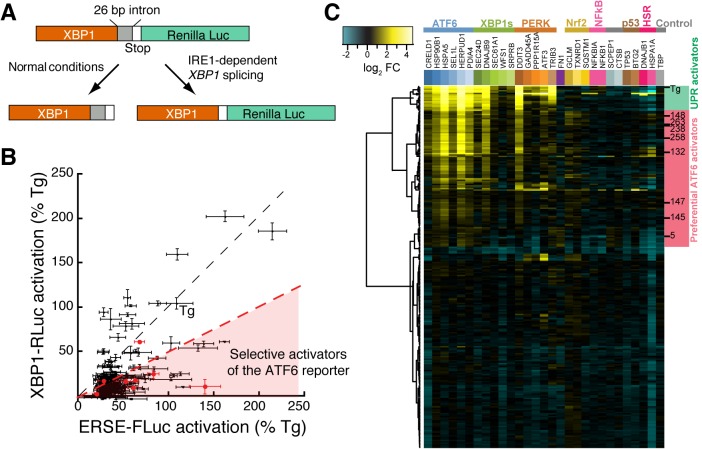
Figure 2. Counterscreening and transcriptional profiling identifies preferential activators of the ATF6 transcriptional program.
(A) Schematic of the XBP1-RLuc splicing reporter used to monitor activation of the IRE1/XBP1s arm of the UPR in HEK293T-Rex cells treated with small molecule ER proteostasis regulators. (B) Plot of ERSE-FLuc activation and XBP1-RLuc activation for the top 281 small molecule ER proteostasis regulators (6.8 µM; 18 hr) in HEK293T-Rex cells stably expressing ERSE-FLuc or XBP1-RLuc. Activation for each axis is shown as the percent signal relative to Tg treatment (500 nM; 18 hr). Prioritized ER proteostasis regulators described in Table 1 are shown in red. Error bars show standard deviation for n = 3. (C) Heat map of multiplex gene expression (MGE) profiling for the top 281 ER proteostasis regulator compounds. HEK293T-Rex cells were incubated with 10 μM of each proteostasis regulator for 6 hr, then cells were lysed and MGE profiling was performed. Genes probed constitute transcriptional targets preferentially induced by the ATF6, XBP1s or PERK arms of the UPR or other stress-responsive signaling pathways, as indicated. Heat map is shown with compounds clustered according to their activity. The green section represents global ER stressors while the pink sections represent molecules that preferentially activate the ATF6 transcriptional program. Prioritized ER proteostasis regulators identified in Table 1 are highlighted.
DOI: http://dx.doi.org/10.7554/eLife.15550.005


