. 2016 Jul 20;5:e15550. doi: 10.7554/eLife.15550

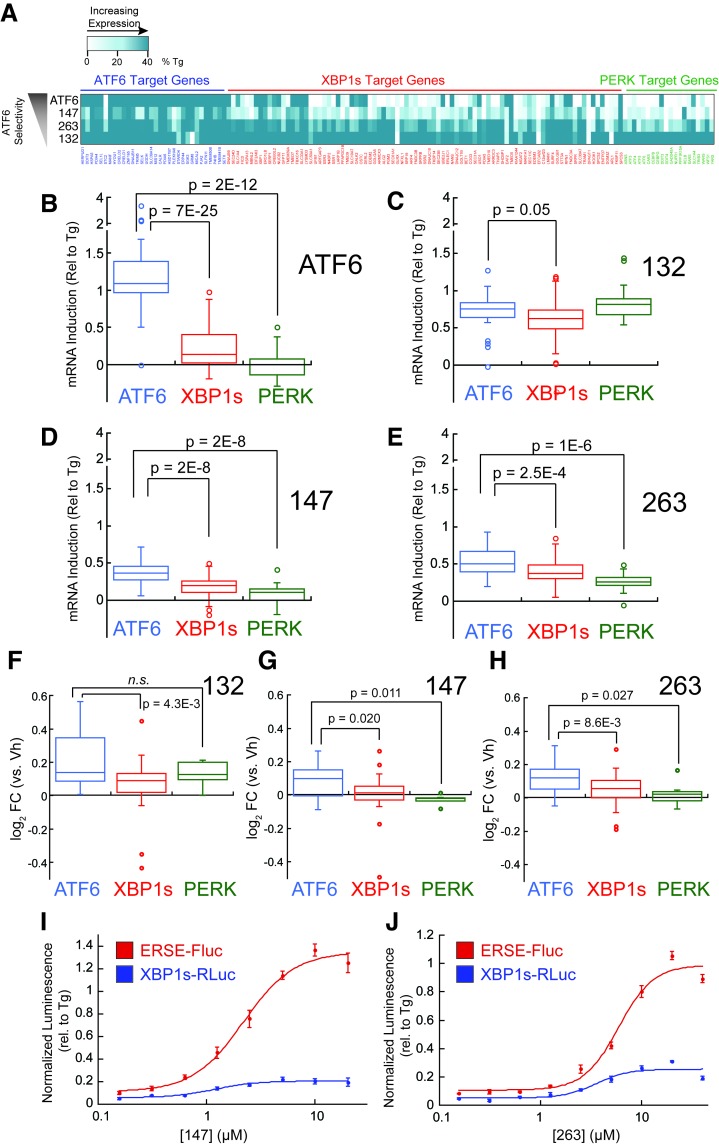
Figure 3. Small molecule ER proteostasis regulators preferentially activate the ATF6 transcriptional program.

(A) Heat map showing the upregulation of ATF6 (blue), XBP1s (red) or PERK (green) target genes in the mRNA-Seq analysis of HEK293T-Rex cells treated with Tg (1 µM), 132 (10 µM), 147 (10 µM) or 263 (10 µM). Genes used in this analysis were selected from published reports indicating their selectivity for ATF6, XBP1s or PERK (Lu et al., 2004; Shoulders et al., 2013). The induction of each gene was normalized to the respective induction observed with the global UPR activator Tg and reported as % Tg induction. The expression of these target genes in the mRNA-Seq analysis of TMP-dependent DHFR-ATF6 activation in HEK293DAX cells is also shown. The data used to prepare this heat map is included in Figure 3—source data 1. (B–E) Box plots showing the relative activation of ATF6, XBP1s, and PERK genesets in HEK293DAX cells following TMP-dependent DHFR-ATF6 activation (B), or HEK293T-Rex cells treated with 132 (C), 147 (D) or 263 (E) from the data shown in Figure 3A. Differences in activation of the ATF6 geneset relative to the XBP1s or PERK genesets were confirmed by one-way ANOVA and the p-values of unpaired t-tests are shown. (F–H) Box plots comparing the average fold change at the protein levels of ATF6, XBP1s and PERK target sets in HEK293T-Rex cells treated with 10 µM 132 (F), 147 (G), or 263 (H) for 16 hr as observed in the proteomics analysis. The protein sets used here are the same as the genesets for the analysis of the RNA-Seq data (A–E). Differences in activation of the ATF6 target protein set relative to the XBP1s or PERK target protein sets were confirmed by one-way ANOVA and the p-values of unpaired t-tests are shown. The data used to prepare these graphs can be found in Figure 3—source data 1. (I–J) Plot showing the relative activation of the ERSE-FLuc (blue) and XBP1-RLuc (red) reporters in HEK293T-Rex cells treated with the indicated concentration of 147 (I) or 263 (J) for 15 hr. Error bars represent standard error for n = 3 replicates.

DOI: http://dx.doi.org/10.7554/eLife.15550.010

Figure 3—source data 1. Excel spreadsheet containing the RNA-seq and proteomic geneset data used to prepare Figure 3A–H.
This spreadsheet contains 7 tabs including a Table of Contents, Geneset mRNA ATF6, Geneset mRNA XBP1s, Geneset mRNA PERK, Geneset proteomics ATF6, Geneset proteomics XBP1s, and Geneset proteomics PERK.
elife-15550-fig3-data1.xlsx (399.3KB, xlsx)
DOI: 10.7554/eLife.15550.011

Figure 3.

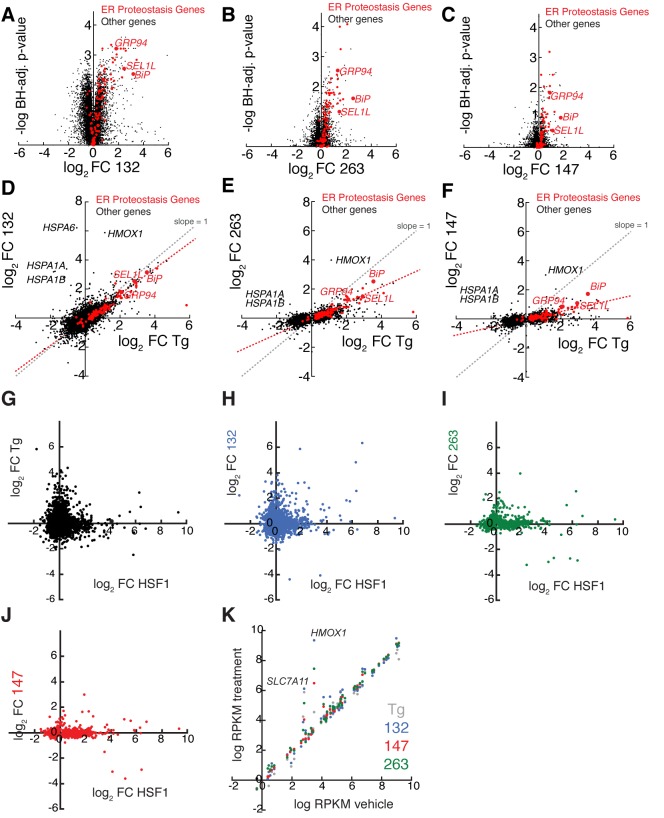
Figure 3—figure supplement 1. mRNA-Seq analysis shows that ER proteostasis regulators do not globally activate the Heat Shock Response (HSR) or oxidative stress response pathways.

Figure 3—figure supplement 1.

(AC) Volcano plots showing log2 mRNA fold-change (FC, relative to vehicle-treated controls) versus -log10 Benjamini Hochberg (BH) adjusted p-value for mRNAs in HEK293T-Rex cells treated with small molecule ER proteostasis regulators 132 (A), 263 (B) or 147 (C) (all treated at 10 µM, 6 hr). The red symbols represent ER proteostasis factors as identified in the Source Data. The ATF6-regulated ER proteostasis genes BiP, GRP94, and SEL1L are highlighted. (D–F) Correlation of log2 mRNA fold change (FC) with Tg (1 µM; 6 hr; relative to vehicle-treated control) versus log2 mRNA FC with small molecule ER proteostasis regulators 132 (D), 263 (E) or 147 (F) in HEK293T-Rex cells (treated as indicated above). All genes displaying a significant change (BH adjusted p-value < 0.1) for Tg-treatment or treatment with small molecule ER proteostasis regulators are shown. The red symbols represent ER proteostasis factors, as identified in the Source Data. The gray dashed line reflects levels of gene induction observed following Tg-induced ER stress (slope = 1). The red dashed line corresponds to a least squares linear regression that reflects the induction of ER proteostasis gene induction observed following treatment with the indicated small molecule ER proteostasis regulator. Treatment with 132 (D) shows a clear correlation with Tg treatment indicating global UPR activation, while 263 (E) and 147 (F) do not globally increase transcription of Tg-regulated genes and show lower levels of select ER proteostasis gene induction. The ATF6-regulated ER proteostasis genes BiP, GRP94, and SEL1L are highlighted. GJ. Plot showing the log2 transcript fold change with Shield-1-dependent FKBP-HSF1 activation in HEK293T-Rex cells stably expressing FKBP-HSF1 (mRNA-seq analysis) (Ryno et al., 2014) versus log2 mRNA fold change with Tg (G) or small molecule ER proteostasis regulators 132 (H), 263 (I), or 147 (J) in HEK293T-Rex cells. The FKBP-HSF1 fusion protein is activated by the addition of the pharmacologic chaperone Shield-1, which stabilizes the active FKBP-HSF1 protein and promotes HSF1 transcriptional activity (Ryno et al., 2014). All gene expression data used in this analysis are included in the Source Data. Only genes whose expression is significantly altered (FDR < 0.1) by FKBP-HSF1 activation in HEK293T-Rex cells are shown. (K) Plot comparing the expression of oxidative stress target genes in HEK293T-Rex cells treated with vehicle or Tg (1 µM; grey), 132 (10 µM; blue), 147 (10 µM; red) or 263 (10 µM; green). The data are presented as log reads per kilobase million (RPKM) of vehicle versus log RPKM for the indicated treatment using the data from our mRNA-seq analysis. Genes that fall on the diagonal are not induced by small molecule treatment. Oxidative stress genes were selected from the SABIOsciences Oxidative Stress PCR Array.
Figure 3—figure supplement 1—source data 1. Excel spreadsheet describing the RNA-seq data used to prepare Figure 3—figure supplement 1A–K.
This spreadsheet contains 4 tabs including a Table of Contents, RNA-seq FC Tg 132 147 263 ATF6, HSF1 genes, and oxidative stress genes.
DOI: 10.7554/eLife.15550.013
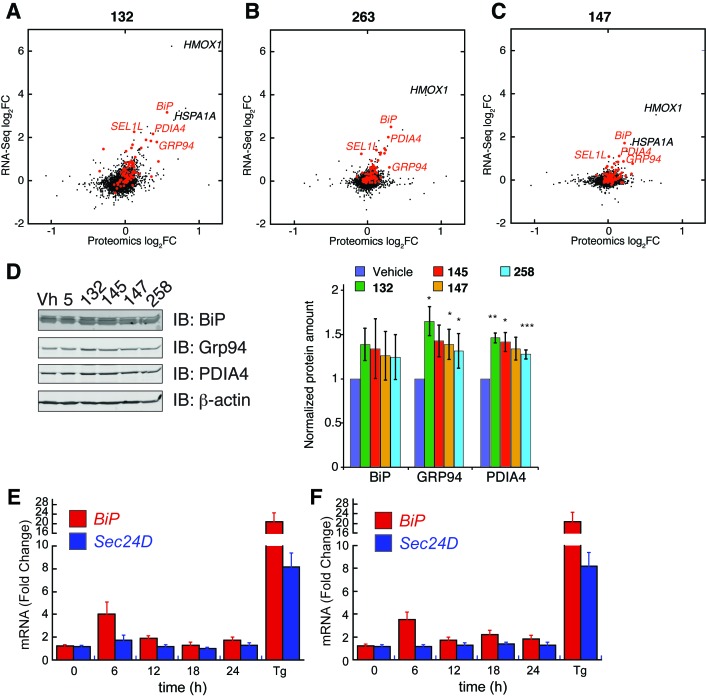
Figure 3—figure supplement 2. ER proteostasis regulators induce ATF6 targets at the protein level and time-dependence of ATF6 and XBP1s target activation.

Figure 3—figure supplement 2.

(A–C) Correlation between mRNA fold changes (FC) and protein fold changes for treatment of HEK293T-Rex cells with compounds 132 (A), 263 (B), and 147 (C). mRNA changes were measured by RNA-Seq after 10 µM compound treatment for 6 hr. Protein changes were measured by Tandem-Mass-Tag-based quantitative proteomics after 10 µM compound treatment for 16 hr. ER proteostasis genes are marked in red and select ATF6 targets are labeled. (D) Representative immunoblot and quantification of select proteins regulated by the ATF6 transcriptional program assessed by quantitative Western blot. HEK293T-Rex cells were treated with ER proteostasis regulators (10 µM) for 16 hr and whole cell lysates were separated by SDS-PAGE and immunoblotting was carried out using antibodies against the indicated proteins. Quantification was performed on an Odyssey Licor. Error bars represent standard error for n = 3 replicates. *p<0.05; **p<0.01; ***p<0.001 (E–F) Time course of induction of BiP (a gene regulated by the ATF6 transcriptional program) and SEC24D (a gene regulated by the XBP1s transcriptional program) mRNA as measured by qPCR in HEK293T cells treated for the indicated times with 10 µM of 263 (E) or 147 (F). Error bars represent the standard error for n > 3 biological replicates.
Figure 3—figure supplement 2—source data 2. Excel spreadsheet describing the whole cell proteomic data used to prepare Figure 3—figure supplement 2A–C.
RNA-seq data for genes identified by proteomics is also shown. This spreadsheet contains 4 tabs including a Table of Contents, 132 Proteomics RNA-Seq, 263 Proteomics RNA-seq, and 147 Proteomics RNA-seq.
DOI: 10.7554/eLife.15550.015