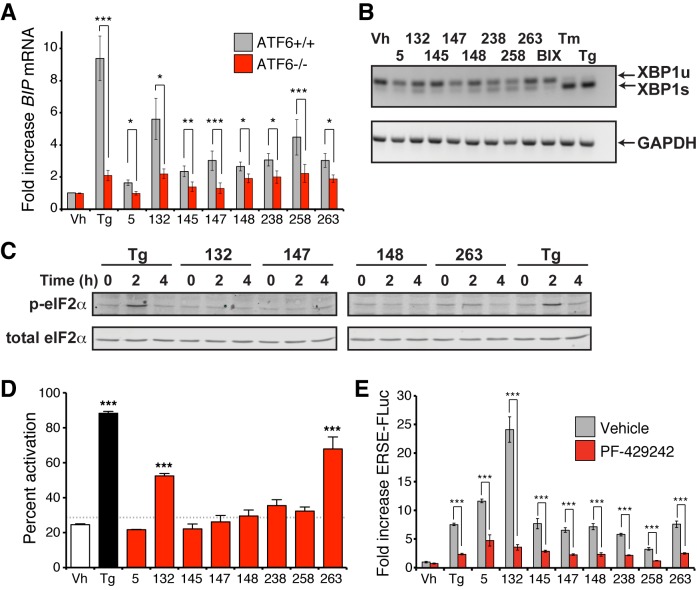
Figure 4. ER proteostasis regulators depend on endogenous ATF6 activation. .
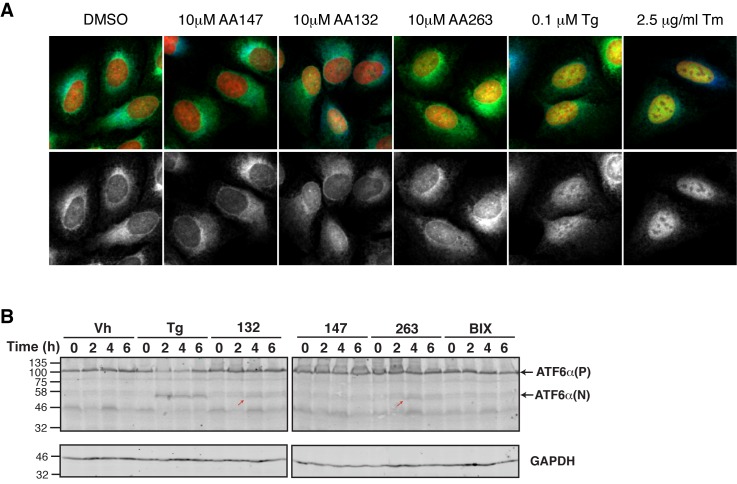
(A) BIP mRNA measured by qPCR in ATF6+/+ and ATF6-/- MEFs treated with the indicated small molecule ER proteostasis regulators (10 µM; 6 hr). Error bars show standard error for n > 3. *p<0.05; **p<0.01; ***p<0.001. (B) Gel showing XBP1 splicing in HEK293T cells measured by RT-PCR. RNA was extracted from cells treated with global ER stressors Tg (500 nM) or tunicamycin (Tm; 1 µg/mL) or 10 µM of the indicated small molecule ER proteostasis regulator for 3 hr. The small molecule BIX is included as a control. After generation of cDNA, primers flanking the XBP1 splicing site were used to amplify the longer unspliced (XBP1u) or 26-nt shorter spliced (XBP1s) segment. (C) Immunoblot showing eIF2α phosphorylation in HEK293T cells treated with Tg (500 nM) or 10 µM of the indicated small molecule ER proteostasis regulator for the indicated time. (D) Activation of ATF6 as measured by nuclear localization of GFP-ATF6. U2OS-GFP-ATF6 cells were treated with the top 8 small molecule ER proteostasis regulators (10 µM; 5 hr) or Tg (100 nM; 5 hr) and subcellular localization of GFP was assessed by confocal microscopy (representative images are shown in Figure 4—figure supplement 1A). The nuclear:ER ratio of GFP signal corresponding to activation of GFP-ATF6 was calculated by comparing vehicle to Tg treatment. Error bars show standard error for n = 3 replicates. Dotted line shows mean plus three standard deviations from vehicle treated controls (28.65%). ***p<0.001 using one way ANOVA followed by Tukey’s Multiple comparison test (compared to vehicle). (E) Plot showing ERSE-FLuc activation in HEK293T-Rex cells treated with the top 8 small molecule ER proteostasis regulators (10 µM; 18 hr) in the presence (red bars) or absence (grey bars) of the S1P inhibitor PF-429242 (10 µM; 18 hr). Cells treated with Tg (500 nM; 18 hr) are shown as a control. Error bars show standard error for n = 3. ***p<0.001.


