. 2016 Jul 20;5:e15550. doi: 10.7554/eLife.15550

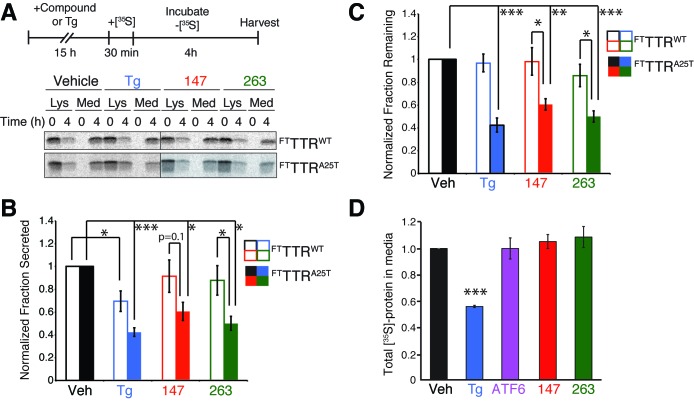
Figure 5. Small molecule ER proteostasis regulators reduce secretion of destabilized amyloidogenic FTTTRA25T from HepG2 cells.

(A) Representative autoradiogram of [35S]-labeled FTTTRWT or FTTTRA25T in the lysate (Lys) and media (Med) of HepG2ATF6 cells pretreated for 15 hr with 10 µM small molecule 147 or 263, or 1 µM Tg, incubated with [35S] for 30 min, and then incubated in fresh non-radioactive media for 0 or 4 hr. The experimental paradigm is shown above. (B) Quantification of the normalized fraction of FTTTRWT (open bars) or FTTTRA25T (colored bars) secreted following a 4 hr chase in HepG2ATF6 cells pretreated for 15 hr with Tg (1 µM; blue) or 10 µM small molecule 147 (red) or 263 (green). Fraction secreted was calculated using the equation: fraction secreted = [extracellular [35S]-TTR signal at t=4h / (extracellular [35S]-TTR signal at t=0h + intracellular [35S]-TTR signal at t=0h)]. Normalized fraction secreted was calculated relative to vehicle-treated controls using the equation: normalized fraction secreted = fraction secreted treatment / fraction secreted vehicle. Representative autoradiograms are shown in Figure 5A. Raw fraction secreted is shown in Figure 5—figure supplement 1C. Error bars show standard error for n = 4 replicates; *p<0.05, ***p<0.001. (C) Quantification of the normalized fraction of FTTTRWT (open bars) or FTTTRA25T (colored bars) remaining (lysate + media) following a 4 hr chase in HepG2ATF6 cells pretreated for 15 hr with Tg (1 µM; blue) or 10 µM small molecule 147 (red) or 263 (green). Fraction remaining was calculated using the equation: [(extracellular [35S]-TTR signal at t=4h + intracellular [35S]-TTR signal at t=4h) / (extracellular [35S]-TTR signal at t=0h + intracellular [35S]-TTR signal at t=0h)]. Normalized fraction remaining was calculated relative to vehicle-treated controls using the equation: normalized fraction remaining = fraction remaining treatment / fraction remaining vehicle. Representative autoradiograms are shown in Figure 5A. Error bars show standard error for n = 4 replicates; *p<0.05, **p<0.01, ***p<0.001. (D) Quantification for normalized total [35S]-labeled proteins secreted from HepG2ATF6 cells following 15 hr pretreatment with 1 µM Tg (blue), TMP (10 µM)-dependent DHFR-ATF6 activation (purple), or 10 µM small molecule ER proteostasis regulators 147 (red) or 263 (green). The experimental protocol and a representative autoradiogram for this experiment is shown in Figure 5—figure supplement 1F. The recovery of [35S] labeled proteins is normalized to the vehicle-treated control. Error bars show standard error for n = 4 replicates. ***indicates p<0.001.

DOI: http://dx.doi.org/10.7554/eLife.15550.018

Figure 5.

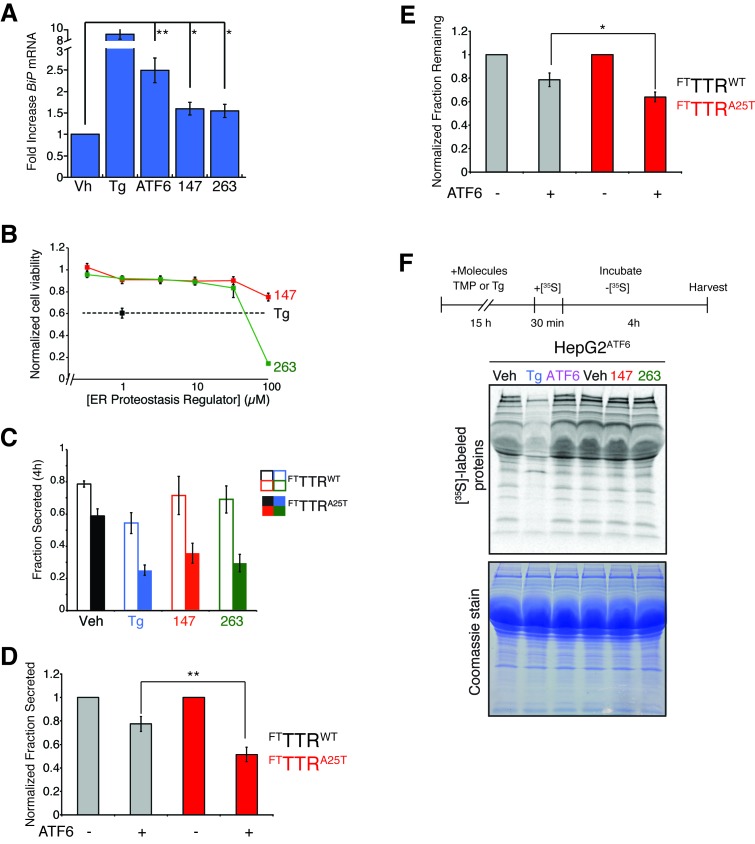
Figure 5—figure supplement 1. ER proteostasis regulators reduce secretion of destabilized amyloidogenic TTRA25T from HepG2 cells.

Figure 5—figure supplement 1.

(A) Plot showing the fold increase of BiP mRNA in HepG2ATF6 cells treated with Tg (1 µM), TMP (activates DHFR-ATF6; 10 µM) or 10 µM of the indicated small molecule ER proteostasis regulators. Error bars show standard error for n = 3. *p<0.05, **p<0.01. (B) Toxicity from 48 hr incubation of HepG2ATF6 cells with Tg (1 µM) or small molecules 147 or 263 at the indicated concentration as read by CellTiter-Glo. Error bars represent standard error from n = 6 replicates. (C) Quantification of the fraction FTTTRWT (open bars) or FTTTRA25T (colored bars) secreted following a 4 hr chase in HepG2ATF6 cells pretreated for 15 hr with Tg (1 µM; blue) or 10 µM small molecule 147 (red) or 263 (green). Fraction secreted was calculated using the equation: fraction secreted = [extracellular [35S]-TTR signal at t / (extracellular [35S]-TTR signal at t=0 + intracellular [35S]-TTR signal at t=0)]. Representative autoradiograms are shown in Figure 5A. Error bars show standard error for n = 4 replicates. (D) Quantification of normalized fraction secreted of FTTTRWT (grey) or FTTTRA25T (red) from HepG2ATF6 cells following 15 hr pretreatment with TMP (10 µM; activates DHFR-ATF6). Fraction secreted was calculated using the equation: fraction secreted = [extracellular [35S]-TTR signal at t / (extracellular [35S]-TTR signal at t=0 + intracellular [35S]-TTR signal at t=0)]. Normalized fraction secreted was calculated relative to vehicle-treated controls using the equation: normalized fraction secreted = fraction secreted treatment / fraction secreted vehicle. Error bars show standard error for n = 9. **p<0.01. (E) Quantification of normalized fraction remaining of FTTTRWT (grey) or FTTTRA25T (red) from HepG2ATF6 cells following 15 hr pretreatment with TMP (10 µM; activates DHFR-ATF6). Fraction remaining was calculated using the equation: [(extracellular [35S]-TTR signal at t + intracellular [35S]-TTR signal at t) / (extracellular [35S]-TTR signal at t=0 + intracellular [35S]-TTR signal at t=0)]. Normalized fraction remaining was calculated relative to vehicle-treated controls using the equation: normalized fraction remaining = fraction remaining treatment / fraction remaining vehicle. Error bars show standard error for n = 9. *p<0.05. (F) Representative autoradiogram and Coomassie images of total [35S]-labeled protein secreted from HepG2ATF6 cells following 15 hr pretreatment with 1 µM Tg, TMP (10 µM)-dependent DHFR-ATF6 activation, or 10 µM small molecule ER proteostasis regulators 147 or 263. The experimental protocol used for this experiment is shown above. Quantification of this experiment is shown in Figure 5D.