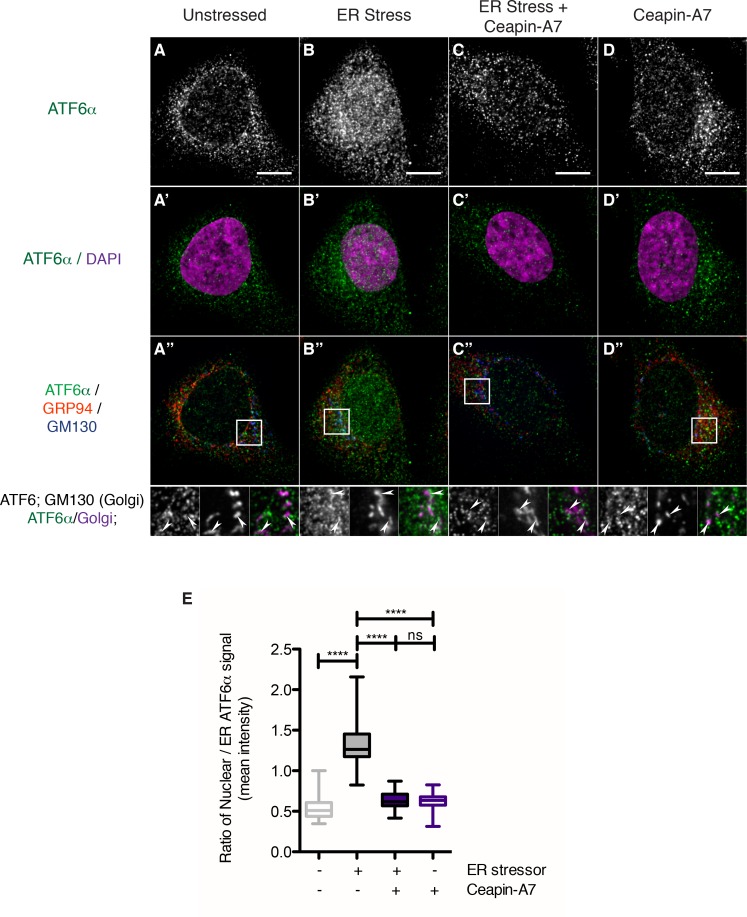
Figure 4. Endogenous ATF6α is in foci in unstressed cells and these foci are not changed by Ceapin-A7 either in the presence or absence of ER stress.
(A–D) Nuclear translocation of endogenous ATF6α in response to ER stress is inhibited by Ceapin-A7. U2-OS cells treated with either vehicle (A, A’,A”) or ER stress (100 nM Tg), in the absence (B,B’,B”) or presence of Ceapin-A7 (C,C’,C”, 6 μM Ceapin-A7) or with Ceapin-A7 alone (D,D’,D”) for two hours prior to fixation and fluorescent imaging of endogenous ATF6, anti-GM130 to mark the Golgi apparatus, GRP94 to mark the ER and DAPI to mark DNA. (A–D) Greyscale images of ATF6α for each treatment. (A’–D’) Merged images of ATF6α (green) and nuclear staining (purple). (A”–D”) Triple color merges of ATF6α (green) with ER (GRP94, red) and Golgi markers (GM130, blue). Boxed insets in (A”–D”) are shown below either as greyscale images of each channel (top row) or double (green/magenta) or triple (green/red/blue) merged images (bottom row). White arrows in boxed inserts point to Golgi staining. Scale bar is 10 μm and boxed inserts are 7 x 7 μm. (E) Quantification of nuclear translocation of endogenous ATF6. Plotted is the ratio of nuclear to ER intensity of ATF6α signal per cell as a box plot, whiskers are minimum and maximum values of the data. Statistics show the results of unpaired, two-tailed t-tests between indicated groups. Data plotted is from one of two independent experiments, each with at least twenty cells per treatment group.

