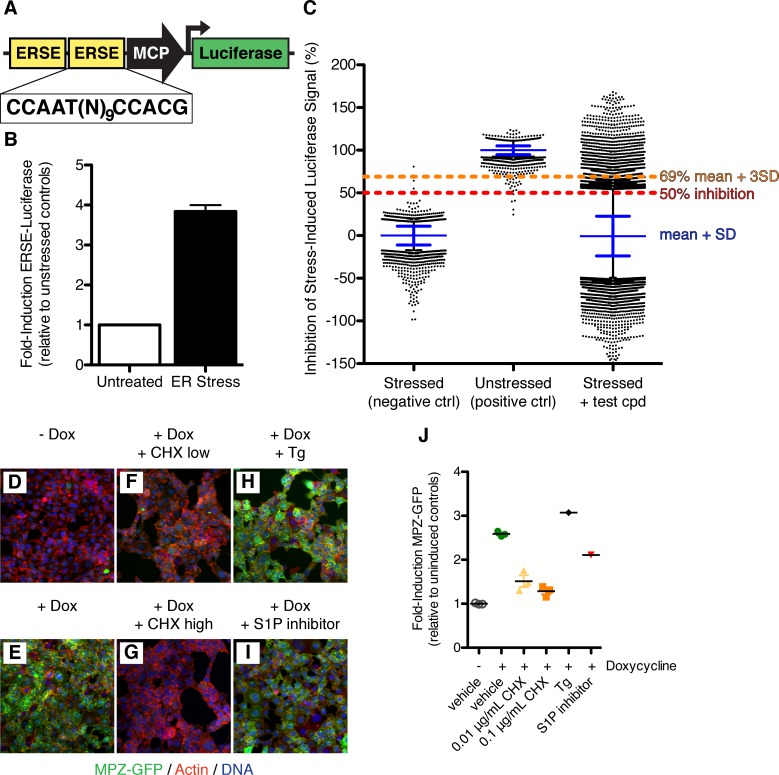
Figure 1. Isolation of small molecule inhibitors of ATF6 mediated transcriptional response induced by ER stress.
(A) Schematic representation of ERSE-luciferase construct used to make screening cell line. Two copies of the ER Stress Response Element (ERSE) were cloned in front of a minimal CMV promoter (MCP) driving expression of luciferase. (B) Luciferase activity is induced 3.84 ± 0.16 fold upon ER stress (100 nM Tg) in ERSE-Luciferase 293T reporter cell line. Mean of three independent experiments with at least duplicate wells is plotted; error bars are standard error of the mean. (C) Primary screen data from ERSE-luciferase transcriptional reporter cell line. Each plate was internally normalized from 0–100% inhibition using stressed and unstressed controls respectively. 106,281 compounds were added in combination with ER stressor and assayed for their ability to inhibit stress-induced production of ERSE-luciferase. Plot shows % inhibition for each control and compound tested - blue lines denote mean and standard deviation of each population, black dots indicate those wells more than two standard deviations away from the mean of the population.1142 compounds scoring more than three standard deviations from the mean (>69% inhibition, orange line) were classified as hits. (D–J). 293 cells expressing doxycycline inducible MPZ-GFP were uninduced (D) or induced with 50 nM doxycycline without (E) or with inhibitors (F–I) for seven hours and then fixed and stained for GFP (green), actin (red) and DNA (blue). Inhibitors tested were the protein synthesis inhibitor cycloheximide at either 0.01 μg/mL (F) or 0.1 μg/mL (G), the ER stressor thapsigargin (100 nM, H) or the S1P inhibitor (50 μM Pf-429242, I). (J) Mean induction of GFP per cell per image was quantified and plotted as fold induction relative to uninduced controls.


