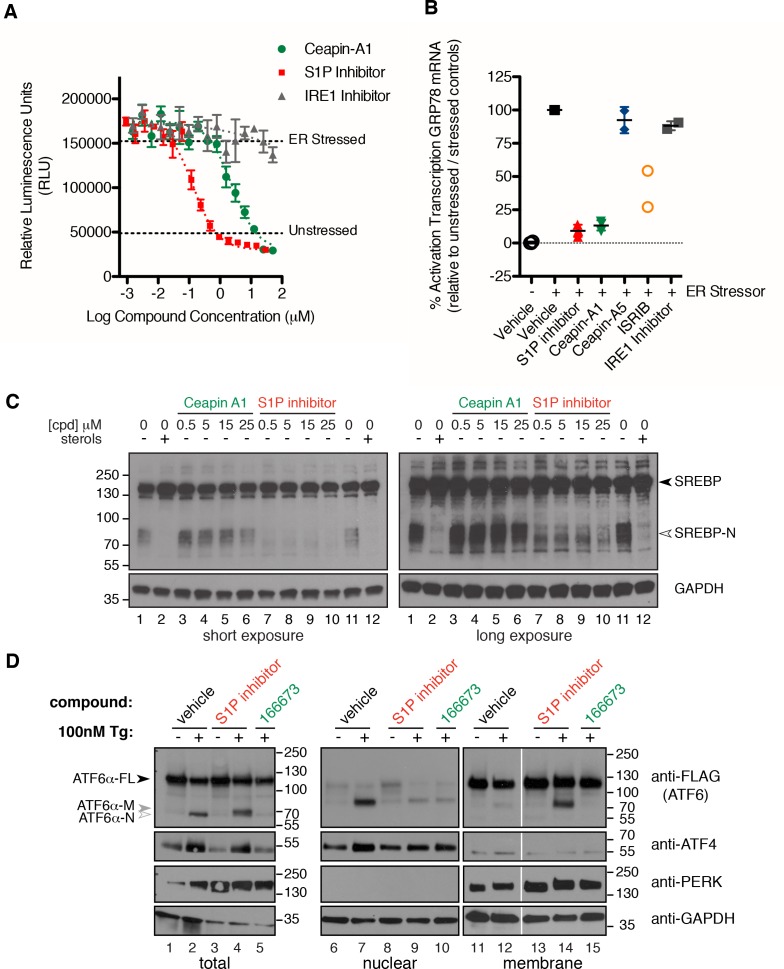
Figure 3. Isolation of Ceapin-A1, a small molecule inhibitor of ATF6 but not SREBP processing.
(A) ERSE-luciferase assay in HEK293T cells. Cells were treated without (DMSO) or with ER stressor (100 nM Tg) in the presence or absence of inhibitors for nine hours. Increasing concentrations of either S1P inhibitor (Pf-429242, red) or Ceapin-A1 (green) but not IRE1 inhibitor (4 μ8C, grey) block ER stress-induced luciferase activity. Plotted is one representative experiment showing mean and standard deviation for each inhibitor concentration (triplicate wells per point). Dashed grey lines indicate the relative luciferase activity of unstressed and stressed controls. (B) ER stress induced upregulation of the endogenous ATF6α target gene GRP78 in U2-OS cells. Cells were treated without (DMSO, open circles) or with ER stress (100 nM Tg, black squares) in the absence or presence of inhibitors for four hours prior to isolation of mRNA. Upregulation of GRP78 mRNA was measured using qPCR. mRNA levels for GRP78 were normalized to GAPDH for each well and then compared to unstressed and stressed controls. ER stress induced GRP78 mRNA induction is inhibited by co-incubation with either S1P inhibitor (2.3 μM Pf-429424, red) or Ceapin-A1 (10 μM, green) but not the inactive Ceapin analog A5 (10 μM, blue). Inhibition of the ISR (200 nM or 400 nM ISRIB, orange) partially inhibits GRP78 induction while inhibition of IRE1 (10 μM 4 μ8C, grey) has only minor effects. Data plotted is the mean percent activation of GRP78 transcription relative to unstressed (0%) and stressed (100%) controls from two or three independent experiments, each with duplicate reactions carried out on duplicate wells. (C) Induction of SREPB processing by lipoprotein depletion in HeLa cells. HeLa cells were grown in lipoprotein deficient media for 16.5 hr prior to addition of either sterols or inhibitors for five hours. One hour prior to lysis proteasome inhibitor (25 μg/mL ALLN) was added to prevent the degradation of the cleaved SREBP-N fragment. Whole cell lysates were analyzed by Western blotting for SREPB1 and GAPDH. Arrowheads denote positions of full-length (SREBP) and cleaved (SREBP-N) variants of SREBP1. Lipoprotein depletion induces cleavage of SREBP (lanes 1, 11) that is inhibited by addition of sterols (10 μg/mL cholesterol, 1 μg/mL 25-hydroxycholesterol, lanes 2, 12) or increasing concentrations of a S1P inhibitor (Pf-429242, lanes 7–10) but not increasing concentrations of Ceapin-A1 (lanes 3–6). Data shown is representative of three independent experiments. (D) Induction of ATF6α processing by ER stress in T-Rex cells expressing FLAG-tagged ATF6α. Arrowheads denote positions of full-length (ATF6α), cleaved membrane-bound (ATF6α-M) and cleaved nuclear (ATF6α-N) variants of ATF6. Cells were treated without (lanes 1,6,11) or with (lanes 2,7,12) ER stressor (100 nM Tg) alone or in combination with either S1P inhibitor (0.75 μM Pf-429242, lanes 3,4,8,9,13,14) or Ceapin-A1 (14.95 μM, lanes 5,10,15) for two hours prior to harvesting. One hour prior to lysis proteasome inhibitor (MG132, 10 μM) was added. Cells were harvested and separated by centrifugation into total, membrane and nuclear fractions and analyzed by Western blot for ATF6α (anti-FLAG), PERK (membrane control), ATF4 (nuclear control) and GAPDH (loading control). Note that totals were run on 10% gels while membrane and nuclear fractions were run on gradient gels to visualize the migration differences between ATF6α-N and ATF6α-M and between PERK and phosphorylated PERK respectively. Data shown is representative of two independent experiments.
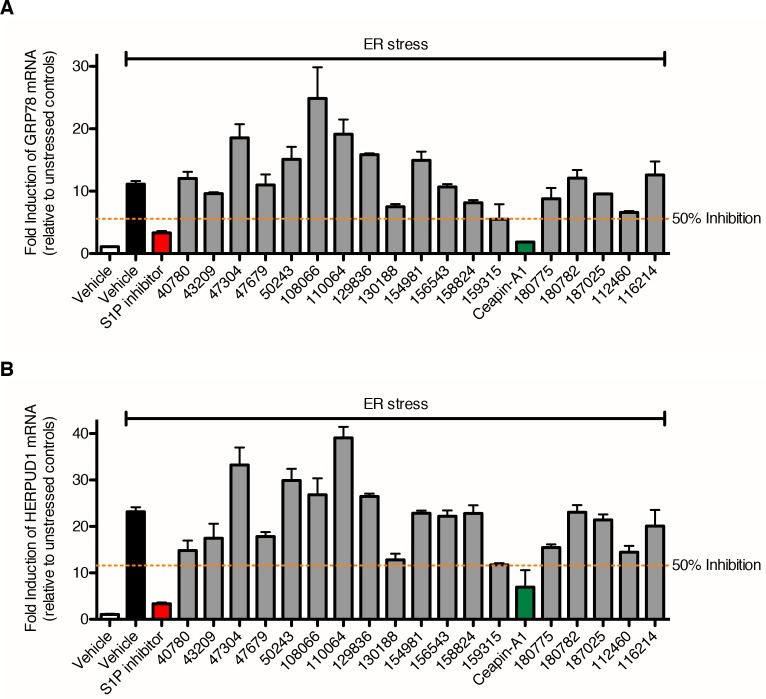
Figure 3—figure supplement 1. Identification of Ceapin-A1, a small molecule that inhibits ATF6 processing in response to ER stress.
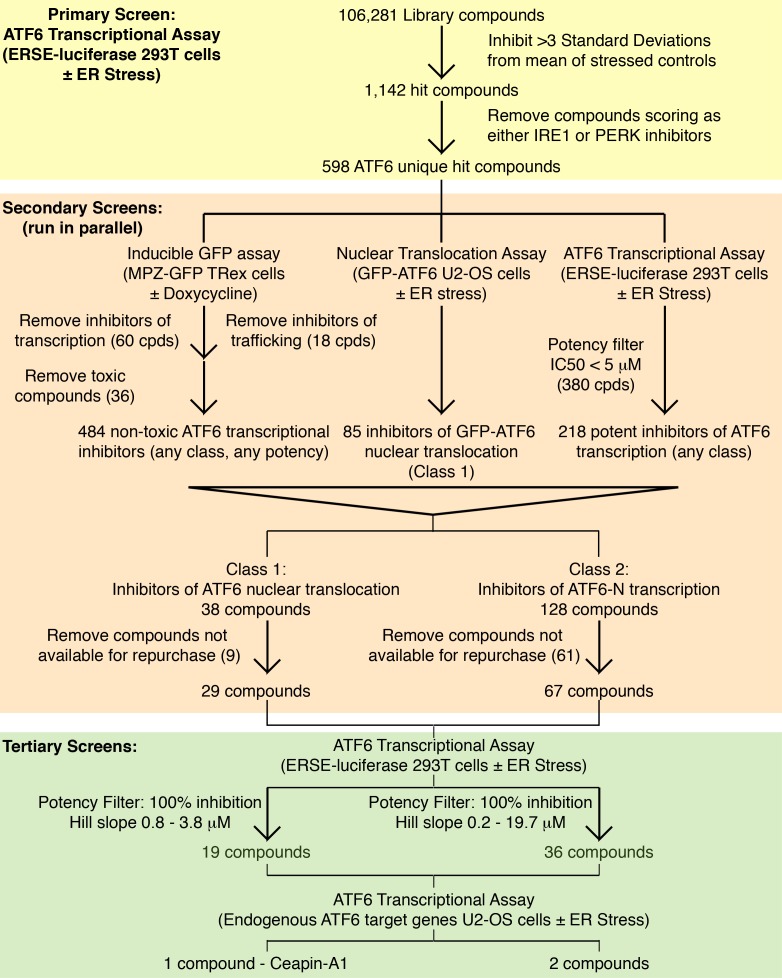
Figure 3—figure supplement 2. Screening workflow Summary of screening workflow that lead to the identification of Ceapin-A1 consisting of primary (yellow), secondary (orange) and tertiary (green) screens.
Figure 3—figure supplement 3. Ceapin-A1 inhibits ER stress induced ERSE-luciferase activity ERSE-luciferase assay in HEK293T cells.
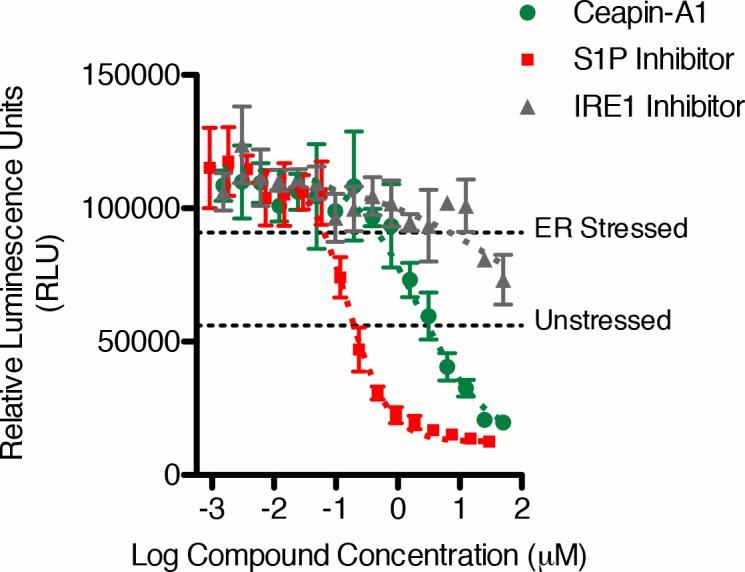
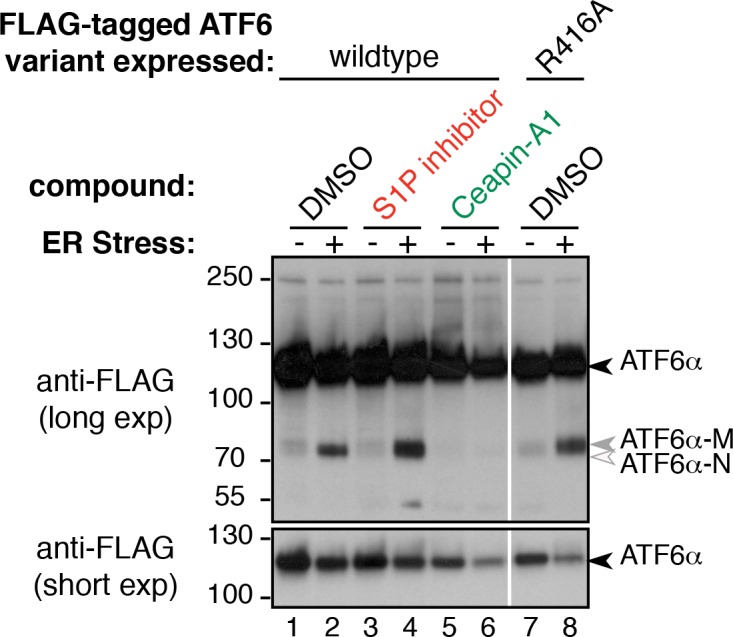
Figure 3—figure supplement 4. Mutation of S1P cleavage site in ATF6α leads to production of ATF6α-M upon ER stress.
