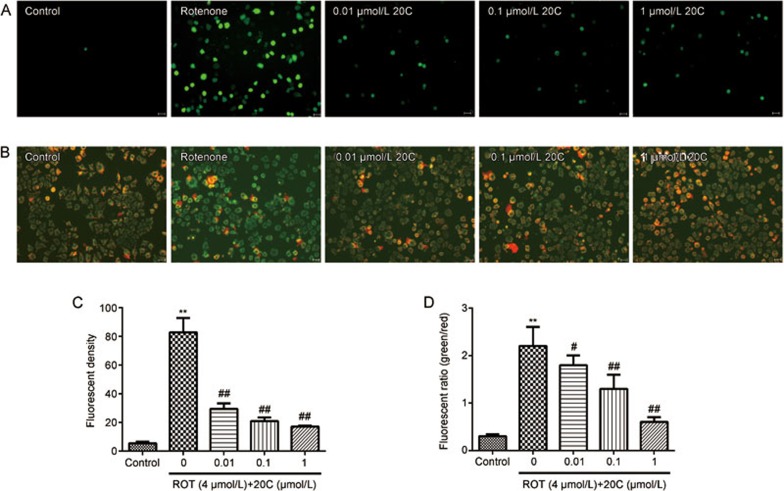
Figure 4.
Effects of 20C on rotenone-induced oxidative stress. (A, B) The ROS levels (A) and MMP (B) of PC12 cells exposed to rotenone in the presence or absence of 20C were determined using DCFH-DA (A) and JC-1 (B). The scale bar represents 20 μm. (C, D) Quantitative analysis of the ROS levels (C) and MMP (D). **P<0.01 vs the control group, #P<0.05, ##P<0.01 vs the model group (n=3).

