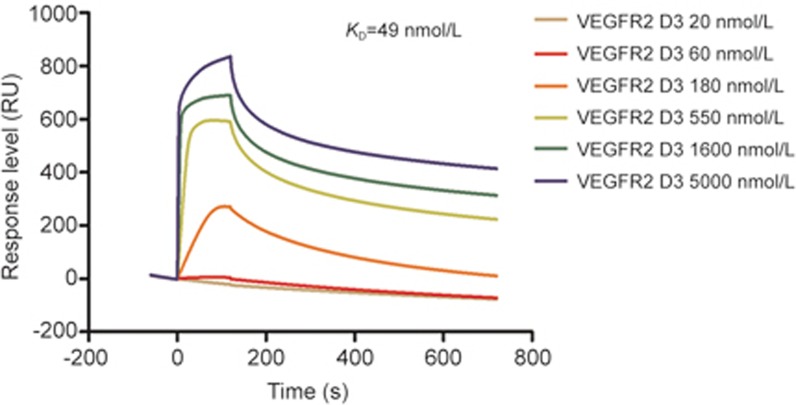
Figure 6.
Interaction of NTV1 with VEGFR2 D3 by surface plasmon resonance (SPR) analysis. Biotinylated NTV1 was injected at a concentration of 10 μmol/L, and the response level was ∼3500 RU. Sensorgram responses at equilibrium were plotted against VEGFR2 D3 at the indicated concentrations (20, 60, 180, 550, 1600 and 5000 nmol/L). The association and dissociation constant (ka, kd) were calculated using Biacore T200 Evaluation software. KD was calculated from the quotient of kd /ka.

