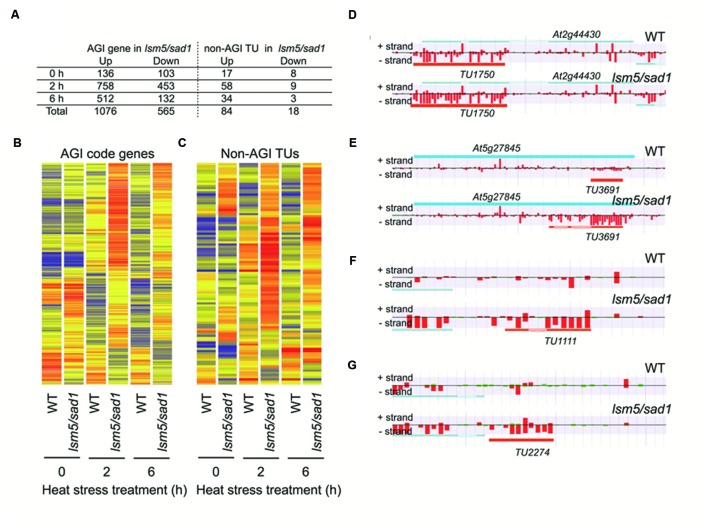
FIGURE 3.
Arabidopsis Genome Initiative (AGI) genes and non-AGI transcriptional units (TUs) that are differentially expressed between the wild-type and the lsm5/sad1 mutant during heat stress. (A) Number of AGI code genes and non-AGI TUs that were upregulated and downregulated in the lsm5/sad1 mutant during heat stress. AGI genes and non-AGI TUs that were differentially expressed between the wild-type and the lsm5/sad1 mutant, as judged by the Mann-Whitney U test (false discovery rate, α = 0.05 ), were further selected using an expression ratio cut-off of twofold higher or lower. Hierarchical clustering analysis of differentially expressed 1641 AGI code genes (B) and 102 non-AGI TUs (C) between the wild-type and the lsm5/sad1 mutant during heat stress. Colored bars indicate relative expression levels. (D,E) Examples of antisense non-AGI TUs upregulated in the lsm5/sad1 mutant. (F,G) Examples of intergenic non-AGI TUs upregulated in the lsm5/sad1 mutant. Tiling array data after incubation at 37°C for 6 h shown in (D-G). In (D-G), blue and orange horizontal bars indicate AGI code genes and predictive non-AGI TU, respectively. Red and green bars indicate the signal intensity of the probes (red > 400, green < 400).

