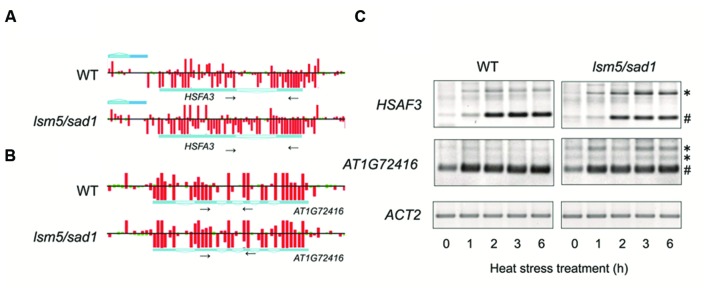
FIGURE 4.
Detection of transcripts improperly spliced in the lsm5/sad1 mutant. Example of the impaired splicing of HSFA3 (A) and AT1G72416 (B) in the lsm5/sad1 mutant, as detected by a tiling array. Pale blue regions in the horizontal bars indicate intron in transcripts. Red and green bars indicate the signal intensity of the probes (red > 400, green < 400). Tiling array data after incubation at 37°C for 6 h shown in (A,B). Small black arrows indicate primers used for RT-PCR analysis in (C), and these regions detected retained an intron in the lsm5/sad1 mutant, as detected by a tiling array. (C) Semi-quantitative RT-PCR analysis to detect unspliced HSFA3 and AT1G72416 transcripts in the lsm5/sad1 mutant. Spliced and unspliced PCR products are labeled as # and ∗, respectively. Ten-day-old seedlings were incubated at 37°C for 0, 1, 2, 3, and 6 h.

