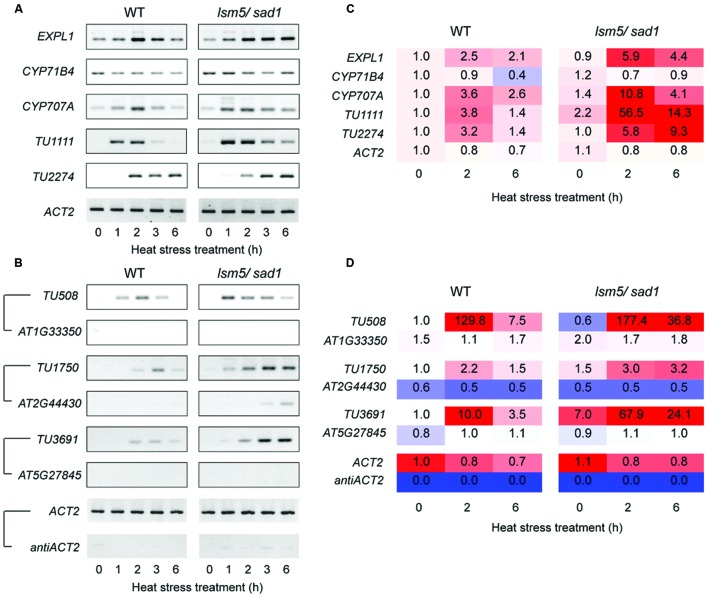
FIGURE 5.
Semi-quantitative RT-PCR analysis for differentially expressed transcripts between the wild-type and the lsm5/sad1 mutant during heat stress. (A) Expression patterns of intergenic-type AGI code genes and non-AGI TUs that were upregulated in the lsm5/sad1 mutant. First-strand cDNA synthesis was performed using oligo(dT) primers, and then PCR was performed using transcript-specific primers. (B) Expression patterns of antisense non-AGI TUs that were upregulated in the lsm5/sad1 mutant. First-strand cDNA synthesis was performed using strand-specific primers for transcripts, and then PCR was performed using transcript-specific primers. Pairs of antisense/sense transcripts are as follows: TU508/AT1G33350, TU1750/AT2G44430, TU3691/AT5G27845, and antiACT2/ACT2. ACT2 and antiACT2 were used as internal controls. Ten-day-old seedlings were incubated at 37°C for 0, 1, 2, 3, and 6 h. (C,D) The fold change values were calculated from transcriptional expression intensities on tiling array data (Supplementary Tables S1 and S3).

