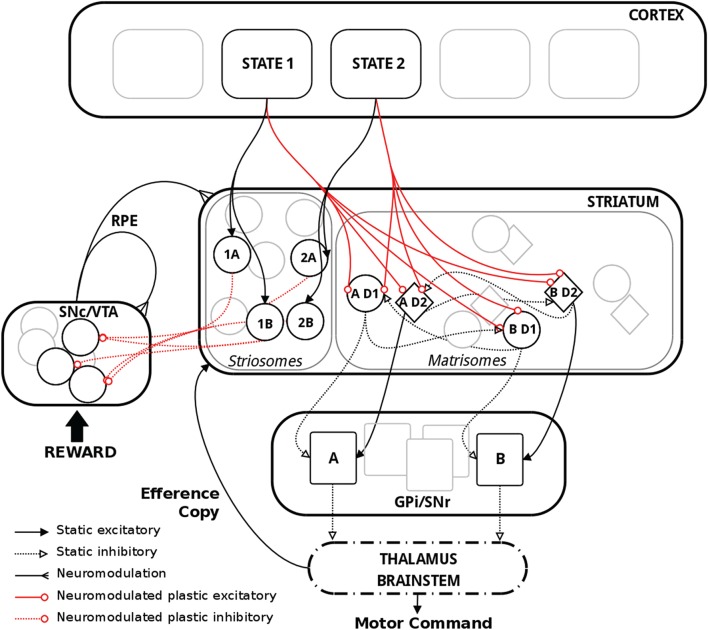
Figure 1.
Schematic representation of the model with relevant biological substrate. In striatum, two actions A and B are here used as an example. The population “AD1” thus corresponds to the population of MSNs in the D1 pathway coding for action A. Striosomes and matrisomes are segregated for visual guidance, but they were intermingled in the model, with striosomes often referred to as “islands” in the matrix. Thalamus and brainstem were not explicitly implemented in the model but are shown above for completeness.

