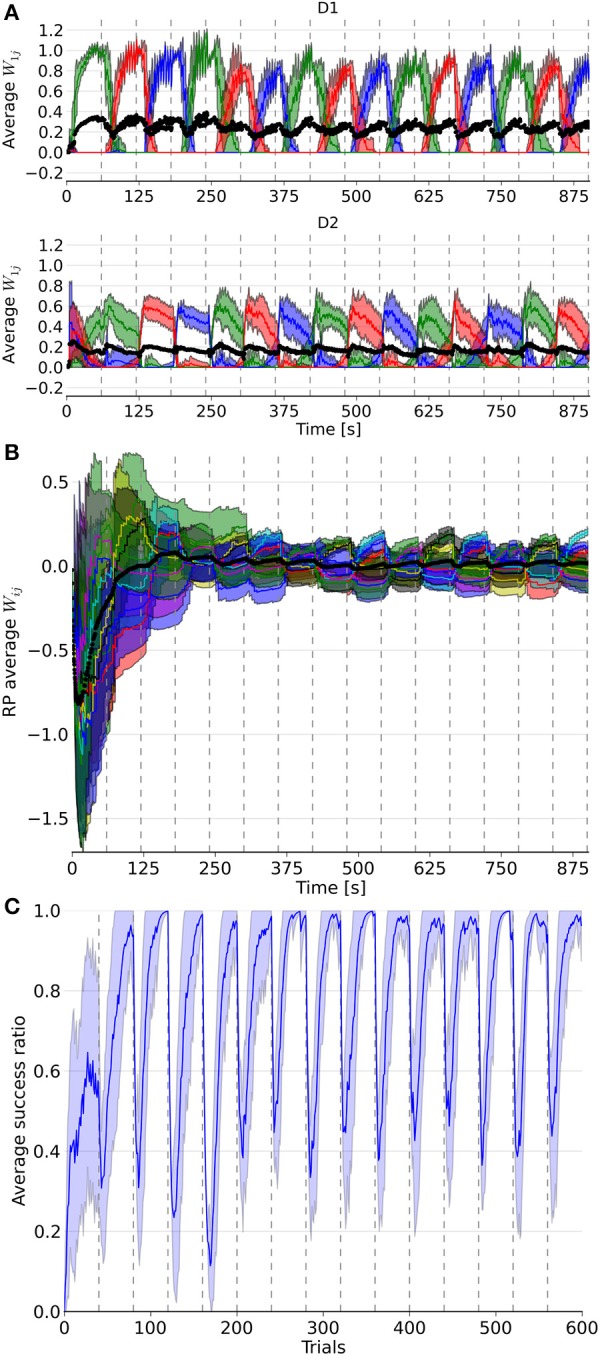
Figure 3.

Evolution of weights in the D1, D2, and RP pathways, as well as the performance over a simulation of 15 blocks with 40 trials each. In (A), the three colored lines represent the average weight of the three action coding populations in D1 and D2 from state 1. (B) represents the color coded average weights from the nine state-action pairing striosomal sub-population to the dopaminergic population. (C) displays the moving average success ratio of the model over the simulation. Vertical dashed gray lines denote the start of a new block. In (A,B), the black line is the total average of the plotted weights. Color-coded shaded areas represent standard deviations.
