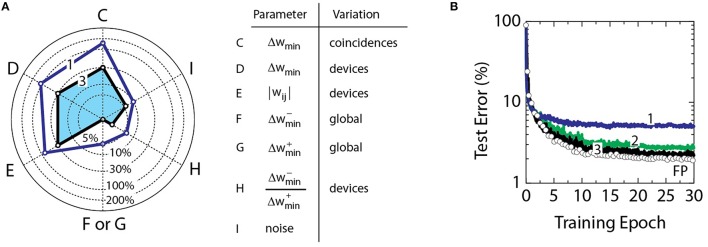
Figure 4.
(A) Line 1 shows threshold values for parameters from Figure 3 assuming a 0.3% error penalty. Parameters C–I correspond to experiments in Figures 3C–I, respectively. The blue shaded area bounded by line 3 results in at most 0.3% error penalty when all parameters are combined. (B) Curve 1 corresponds to a model with all parameters combined at the threshold value as shown in the radar diagram by line 1. Curve 2 corresponds to a model with only C, D, and E combined at the threshold. Curves 1 and 2 have a mean value of 1.0 for weight bounds |wij|. Curve 3 corresponds to a model with C, D, E at 30%, F/G at 0%, H at 2 and I at 6%, all combined as shown in the radar diagram by line 3. Curves 3 has a mean value of 0.6 for weight bounds |wij|. All curves use a mean value of 0.001 for Δwmin.

