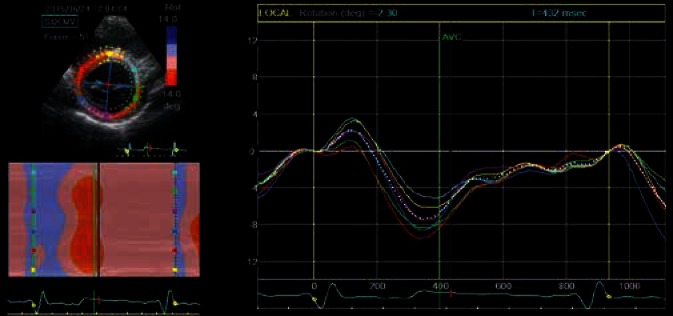
Fig. 6.
An analysis of the rotational movement of the individual segments allows to present its parameters in time in the form of line graphs (each segment in different color) or in the form of a two-dimensional ribbon graph. The figure shows an example of such graphs, illustrating basal left ventricular rotation. The analysis relates to the same ROI as in the previous figure. Clockwise rotation has negative values and is red-coded, counterclockwise rotation has positive values and is blue-coded. Line graph colors correspond to the individual segments in the two-dimensional image. The white dotted line represents a diagram for the average value for all analyzed segments. Early systolic short-lasting basal counterclockwise rotation, which is blue-coded in the ribbon diagram, and represented as positive curve deflection on line graphs, can be observed in the initial, early systolic phase of the cardiac cycle. This is followed by the main part of basal LV rotation – an intense red color and negative deflection of segmental curves. Restoration of baseline values takes place in the initial diastolic phase, prior to ventricular filling

