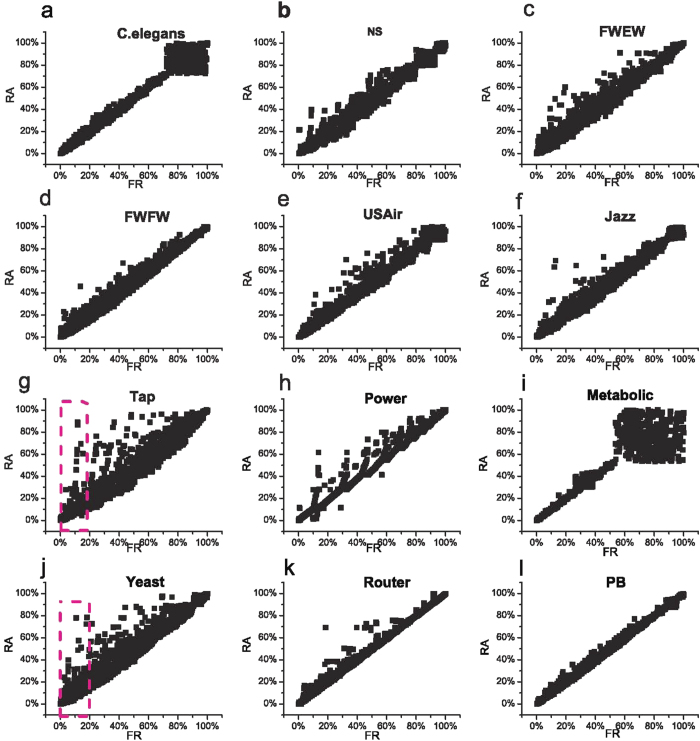
Figure 5. The correlation of ranking values between FR index and RA index based on Precision.
The percentage values in x-axis and y-axis are the top percentage ranking values of FR index and RA index, respectively. The regions marked by pink dash boundary in subfigures (g,j) correspond to the cases in which some links have higher FR ranking values but have lower RA ranking values.

