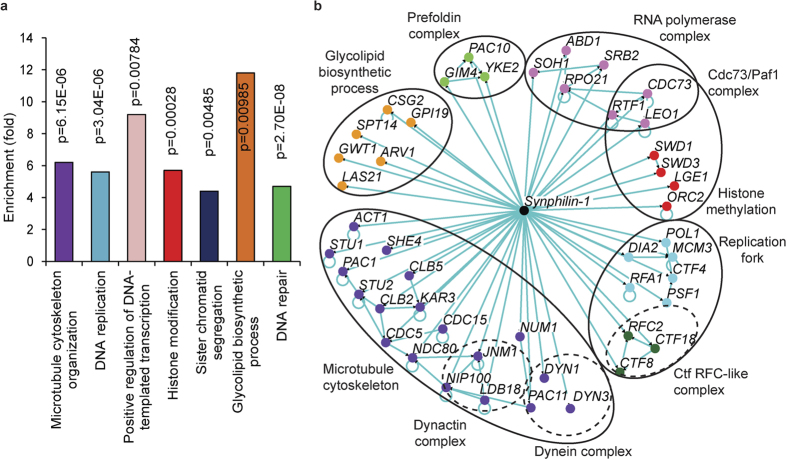
Figure 3. Functional enrichment and network analysis for the confirmed hits with decreased synphilin-1 inclusion formation.
(a) Functional enrichment analysis of mutants with decreased synphilin-1 inclusion formation. Confirmed mutants were analyzed for enrichment of GO functional categories. Enriched groups were scored by comparing to a background list of SGA-V2+ ts-V5 array using a cut-off of P ≤ 0.05. Functional groups are marked with different colors. (b) Network analysis of mutants with decreased synphilin-1 inclusion formation. Mutants showing less cells with synphilin-1 inclusion were grouped into modules based on their known physical interactions and published information of the cellular components. The cellular components are shown in different colored nodes. The circles indicate subunits or protein complexes.

