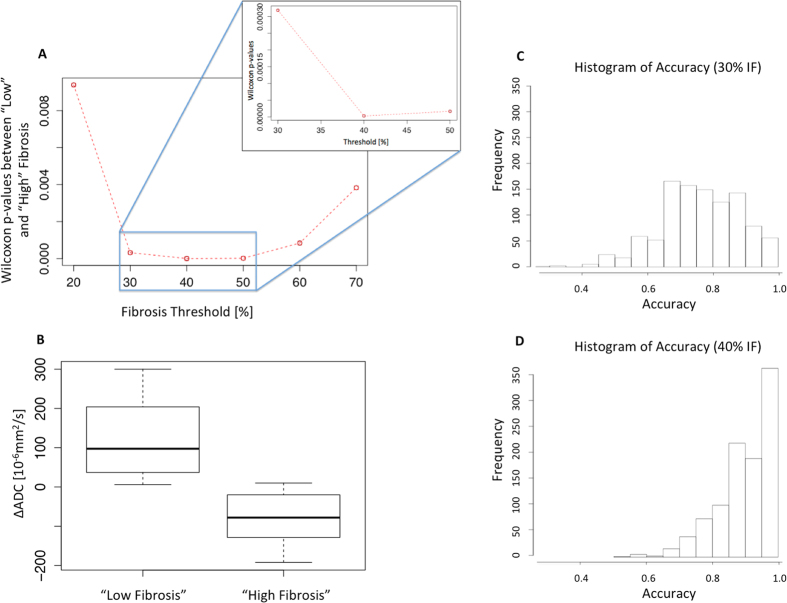
Figure 10. Evaluation of the limit at 40% IF for the definition of “Low Fibrosis” versus “High Fibrosis” detectable using the ΔADC index.
The percentage of IF was defined as binary factor using 2 groups: ‘Low Fibrosis’ and ‘High Fibrosis’. (A) Wilcoxon p-values between ‘Low Fibrosis’ and ‘High Fibrosis’ groups were computed for IF thresholds between 10% and 70% by increment of 10% (with zoom shown for 30% to 50%). The best separation between groups “Low Fibrosis” and “High Fibrosis” was found at a limit of 40% with the lowest p-value computed (p = 2.6 × 10⁻⁶). The other separating limits were 10% (p = 2.0 × 10⁻²), 20% (p = 9.4 × 10⁻³), 30% (p = 3.2 × 10⁻⁴), 40% (p = 2.6 × 10⁻⁶), 50%(p = 1.7 × 10⁻⁵), 60% (p = 8.4 × 10⁻⁵), 70% (p = 3.4 × 10⁻³). Due to the large p-value the 10% threshold is not included on the plot to keep the vertical scale of the remaining points visible. (B) Classification of each ΔADC with this limit at 40% into separate groups as ‘Low Fibrosis’ and ‘High Fibrosis’ groups. At this level of IF, KARs with positive ΔADC and KARs with negative ΔADC can be separated without overlap between the interquartile range (boxes). (C,D) The accuracy of the limit of 40% IF to separate ‘Low Fibrosis’ to ‘High Fibrosis’ groups according to the ΔADC was 91% with 95% CI [0.77–0.99]. Bootstrap values were shifted close to 1.0 at a level of 40% (D) compared to the accuracy distribution at 30% (C), indicating that 40% IF was more accurate to separate “Low” to “High” fibrosis.

